Overview
Since I spent so much time building various models and tracking consensus rankings, I then wanted to use them to evaluate the draft, how each team did, and what picks were good or potential reaches. Yes, evaluating the draft on the day after is "silly" and there will be errors, but if you're just going to say draft grades or rankings are stupid and dumb then just leave. It is just fun for discussion purposes, I will be happy to be proven wrong in a decade when we can actually look back at this class with some certainty, but until then I just enjoy the discussion. I see no difference between this and people trying to predict the standings, or who will win the stanley cup or certain awards. People are frequently wrong about those predictions, but nobody ever says its stupid to talk about Stanley Cup or standings predictions like they do with draft grades. I guess if people are saying it is a final draft grade and they are never willing to change their rankings when we get new information then that would be stupid, but that is a dumb mindset to have. I want to consistently be updating my evaluations with as much information as I can get. In the same way someone would do a preseason standings projection, then a mid-season standings projection after getting the first half season's data.
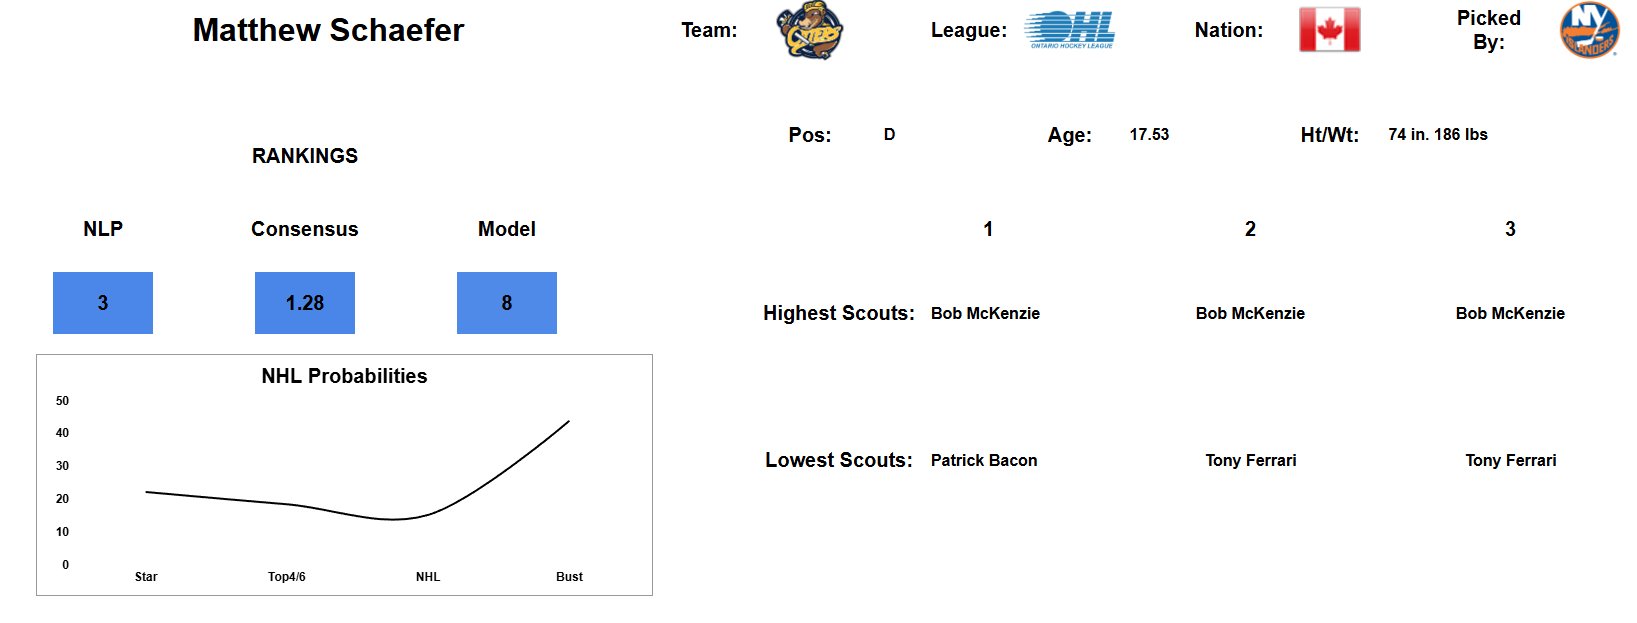
The first thing I did was create a "player card" during the draft that I was posting for the entire first round and some interesting picks throughout the rest of the class. It was a bit rushed and didn't have every player for every stat and also had some data merging errors for certain players (Wills vs Williams mostly). The card lists where the player was ranked by my NHLe model, where they were ranked by the eliteprospects NLP report, and what their consensus rank was. Then it has a graph of their probabilities of reaching each category of player as determined by my NHLe model. Then on the right side it has basic height, weight, age, team, scoring info with the team who selected the player. Then at the bottom I listed the scouts that were the highest on the player, and lowest on the player, which wasn't perfect if more than 2 or 3 sources had the player ranked in the same spot. These were just interesting graphics I wanted to post on draft day to just summarize the models I made, and look at the differences between them. I don't necessarily love using any of the models, but particularly the NHLe model for individual player evaluations, but I like using the three of them combined as to "explain" what a team was looking at when making that pick. I also think that it is perfectly acceptable to use the NHLe model for team class, or full draft evaluations because the "mistakes" tend to balance out in the long run. Here is the card for Matthew Schaefer: bbut if you want the rest of the cards I posted, they're on my twitter, here , and if you want a card that I haven't posted, feel free to reach out and I can share it with you.
The next thing I wanted to look at was to actually "grade" each team's draft class using both the model and consensus board rankings. For the consensus rankings, I creaded simple regression models to predict te odds of a player being a star, Top 6 F/4D, or NHLer based off their draft position, then inputted the consensus rank into those models. Similarly, I used those models for the NHLe model and adjust the rankings for pick values to try and estimate what teams made the best selections relative to pick value. I also, for both models, have the total nnumber of expected players for each team to look at how well this draft will shape their future, and the graphs adjusted for pick values to look at which teams left potential value on the board.
The last thing I looked at was a bunch of trends and how they continued in the 2025 draft. There was a lot of talk about how there weren't any sub 6'0 defensemen taken this year, so I looked at average height, weight, and other trends, like nationality over the course of the past quarter century. I also looked at how correlated the strength of each league (SHL, KHL, WHL, OHL etc) was to the strength of the overall class. I always wondered if strong classes in the OHL always led to strong overall classes and whatnot.
Results
If you want to read a detailed review on any of the sub-parts, or models of the player cards, the articles are here:
• NHLe Model: Here
• Consensus Board: Here
• Eliteprospects Reports NLP: Here
For the team evaluations, I want to start with looking at both the consensus and NHLe models, and which teams did "better" by each ranking. I also didn't do any analysis with the eliteprospects reports NLP rankings because a lot of their reports on guys outside of their rankings were only a few sentences long, and I trusted those reports even less than I trust the top of the rankings.
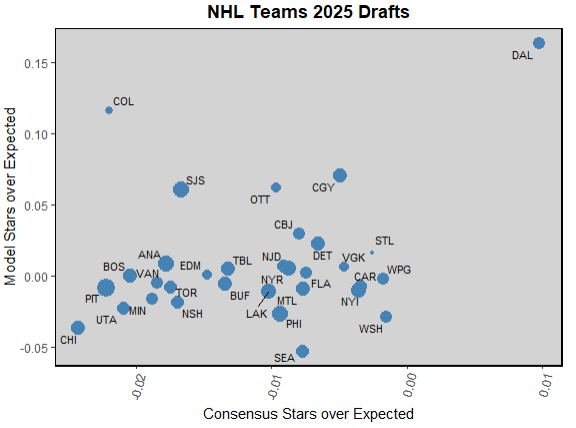
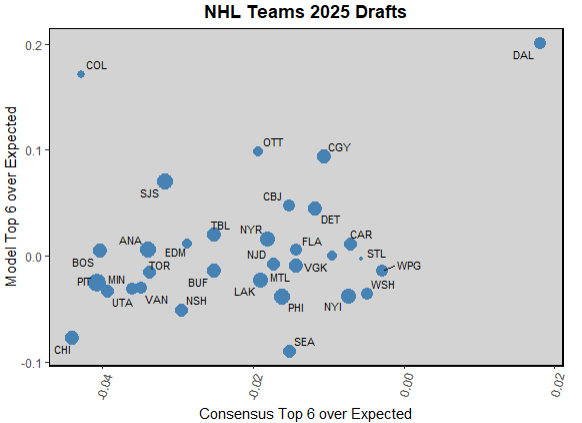
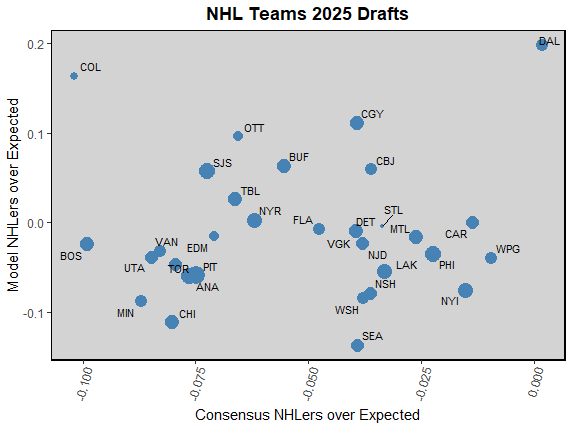
For those graphs, imagine a line running from the bottom left corner to the top right, and teams above the line drafted "better" based off of my NHLe model, and below the line drafted "better" off of consensus. Then the further up and to the right a team is, the better their draft class was. So Dallas, because of the Cam Schmidt (in the 20s in both consensus and NHLe) pick, is on the top right because they had so little draft capital and that was graded as such a nice pick. Obviously there is massive risk in that pick because he is 5'8 161, so I don't think they necessarily killed the draft class like thos selects, but if they actually did get a top 25 player in the late third, the value difference between those two picks is so massive they likely did win the draft class. This will be an interesting case study in NHL fallers because his fall was so far, mostly due to the size, but were there any other issues that NHL teams know about that the public doesn't? Colorado drafting so well by NHLe but so poorly by consensus is another funny result of them having only 3 picks outside the top 75. 2 of those 3 picks were spent on overagers who scored rather well in their respective leagues (relative to draft position) so it's unsurprising that most public outlets weren't really looking at those guys, but the models respect them. Not necessarily as future NHL locks, but as decent bets in the 3rd and 7th rounds. Then Winnipeg and Carolina drafting much better relative to consensus is funny because they always seem to have very similar boards to online consensus and they did it again. Though Carolina is usually up closer to where Dallas is taking all of the small high scoring guys that Twitter loves but NHL teams are iffy on. Washington and NYI also being up there is a good look for the future of those organizations, and a welcome change of pace to what the Isles seem to have been doing recently. Then Calgary, Ottawa, and Detroit all having very respectable classes by both the NHLe model and consensus is another good sign for those 3, Detroit in particular it feels like consensus has been turning on Yzerman, so if he could get a few big hits out of this class it would be huge for their rebuild and hopefully lead the team out of the messy middle.
On the other side of the Dallas island, you have a much larger draft value Chicago island. They'd been drafting relatively well recently it seems, Bedard was an obvious pick, but Moore and Nazar were good picks where they went, and Lev was pretty close to consensus from my memory. But this year Kyle Davidson seemed to take a swing to the opposite side, lighting mid round picks on fire with Cumby and Holmes being exemplary of their strategy this draft. They wanted bigger and more physical players. Frodell at 3rd was loved by some models, but not necessarily by mine, and consensus had him well below 3, and sometimes outside of the top 10 due to questions about his upside and him being more physically developed than most of this class already. Then they drafted 2 6'6 Fs with later first rounders, West being a massive risk high upside guy out of HS, so the models are never going to love that, and consensus was very split on him. Then Nestrasil was another "safer" pick who is big and physically mature but with questions on upside that caused him to be ranked lower in consensus. Then other teams near the bottom were Pittsburgh, who didn't have any glaringly obviously bad picks, but no good picks either, and a bunch of large low scoring d men that don't have a track record of working out well historically. Then Boston wasn't hated as much by NHLe, but was one of the bottom teams by consensus, which is not a good sign for the start of either of those teams rebuilds. Then seeing Minnesota near the bottom shocked me, they still have Judd Brackett as their head scout and he has always been highly praised by public scouts, and they seem to have had great classes recently by consensus and my NHLe model, but not thise year.
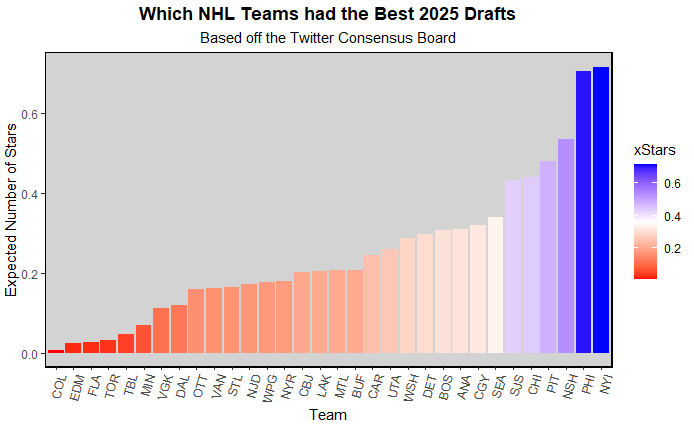
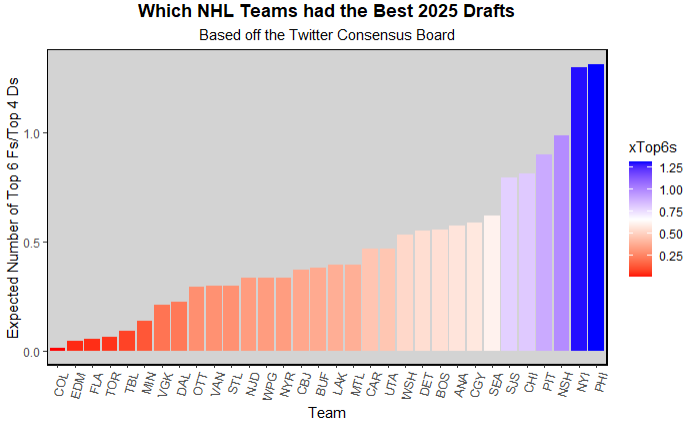
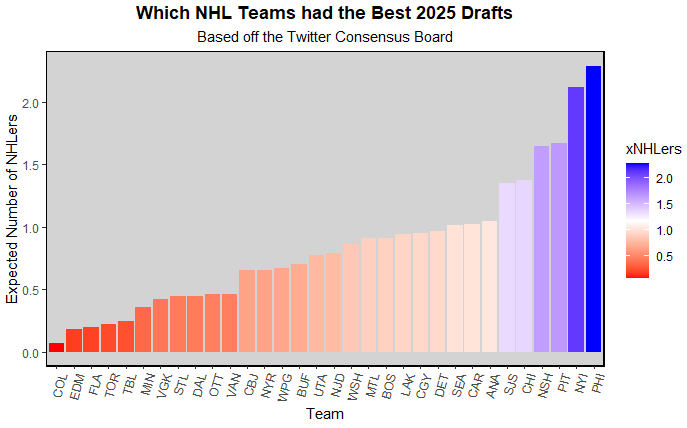
Now looking at just the consensus board totals, the teams you see at the top, NYI and PHI are not surprising, they NYI had 1 OA and 2 mid firsts, and PHI had 6 OA, another first, and 4 seconds. With all that draft value, this was a crucial draft for those teams, and they are expected to get a few NHLers each, and are more likely than not to get a star out of this class. Similarly, on the other end of the spectrum, COL, EDM, FLA, and other team near the bottom are contending and had very few picks to accumulate future talent. Most of those teams would be lucky to get one guy, which is kind of expected when you don't have a pick until the mid-late third. I also think that all of those teams would be perfectly happy to not get an NHLer out of the next 3 classes if they win the cup this season.
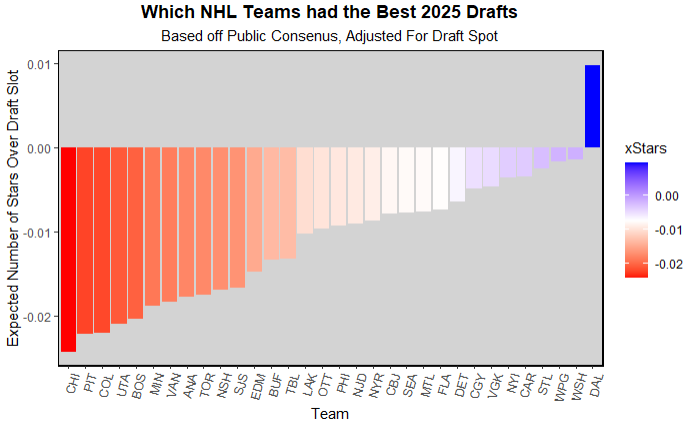
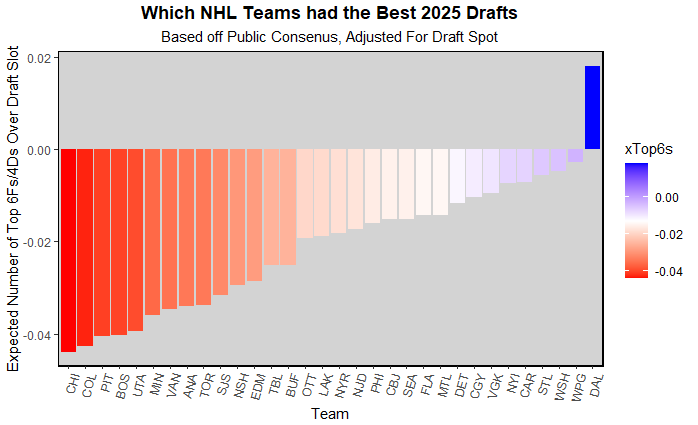
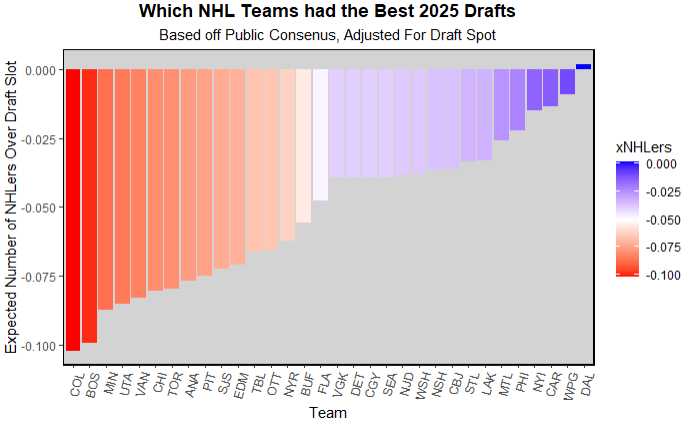
Now looking at the same draft charts but adjusted for pick value, there are some interesting results. Dallas was the only team that didn't "reach" relative to consensus, but that doesn't worry me because A. teams did reach, and there were many players selected that were entirely unranked by all ~50 boards, and B. the way I created the consensus board had less than 32 picks per round, so it was inevitable that some teams would reach in the first round, because there just weren't 32 consensus first rounders. So just looking at the teams relative to each other, it's unsurprising to see Dallas at the top because they had a small sample size and drafted Cam Schimidt late. Then NYI and PHI being 4 and 5 for projected NHLers is huge for those two organizations because they had a lot of draft capital, so if consensus is right, those teams future should be looking bright. Though it does worry me that Philly picked a lot of seemingly low upside guys, as they fell to middle of the table in the star rankings. Pittsburgh had a similar draft, but worse across the board, they had so many picks that they should get some guys, but likely won't get as many stars as they could have (and that is their biggest need in my opinion, but that's a different rant, for a different time). Then seeing CHI, COL, and BOS consistently at the bottom isn't shocking, or particularly interesting to me, but seeing Utah there surprised me. Desnoyers was a consensus reach at 4 because he wasn't Martone or Hagens, then after him they only had one other pick in the top 75 that they could reasonably make up value with, and they chose Max Psenicka, not a bad player, but not a consensus steal that would have been needed to make up for the Desnoyers reach
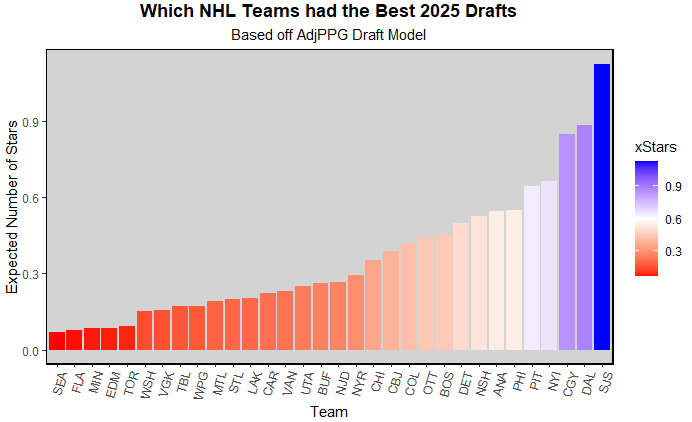
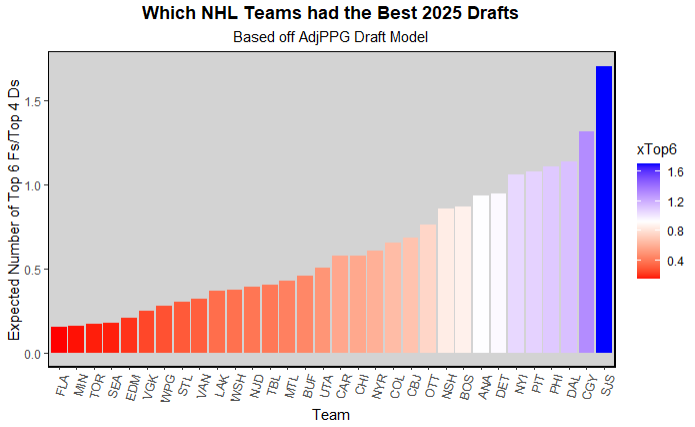
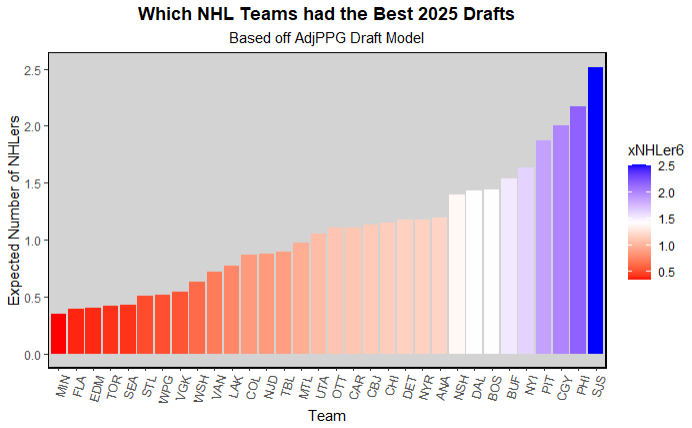
Moving on to NHLe "grades" you see similar trends to the consensus charts where teams with a lot of draft capital hopefully got a lot of future players. Mike Greier in SJ did great, mostly by picking Misa, who my model had as the number one player in this class. Then you see similar teams near the top, Philly, Calgary, Pittsburgh because they had so much draft capital. NYI doesn't grade out as well because they drafted a few d men, and my model was consistently lower/more uncertain about them. Seeing Dallas that high in expected stars and NHLers because of ONE guy is funny to me, but again, if Schmidt hits despite his size, he does have as much upside as almost anyone else in this class, so that was a great pick in the late 3rd. Similarly at the bottom you see a lot of teams with few picks, and mostly late picks, then Seattle. The model is not a fan of Jake O'Brien (at least that high), and after that, they didn't take any high upside swings to balance out the "reach" on O'Brien. Which I think tracks with their team building philosophy well, get as many NHLers, and pray one of them develops into a star with more ice time or opportunity, and it hasn't worked out particularly well for them so far.
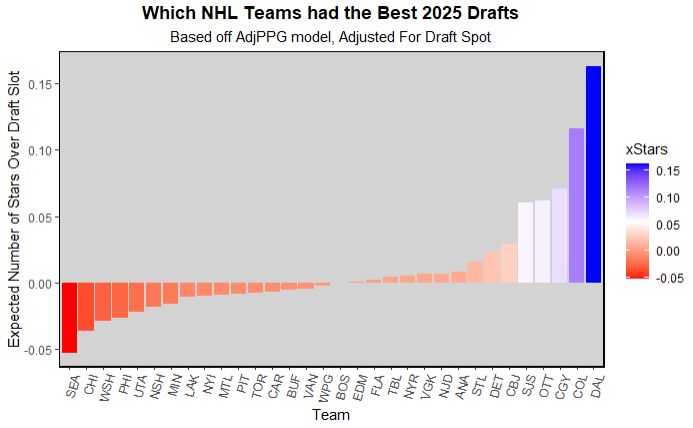
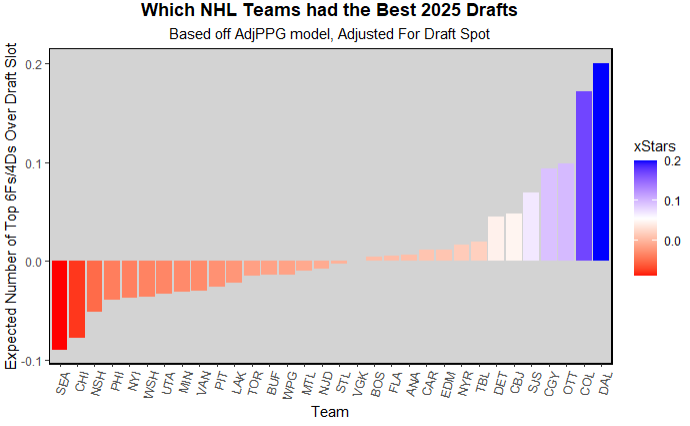
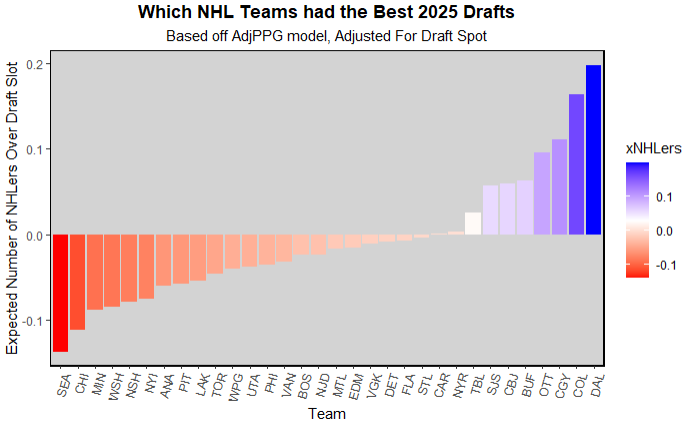
Finally, looking at the NHLe charts adjusted for pick values, we see similar results to what we've been seeing and what I expected by this point. Dallas and Colorado killing it with small sample sizes, and Seattle and Chicago at the bottom by themselves. The next few teams are what interest me, Washington drafting few stars was generally well liked by consensus, but clearly the model doesn't think as highly of Gastrin or Lakovic. Then Nashville was another team that drafted a ton, but didn't quite get good value. Martin was much lower in the model, that didn't account for his U18 performance, and Lee was also not even the top USHL player in my model, despite my personal opinions having watched a lot of the USHL this year. Then Rombach at 35, a physical DFD in a run where so many physical DFDs went, but the model is never going to love picks like that. Then the next few teams at the top, OTT and CGY didn't shock me, but give positive signs for those two teams to finally take the next step eventually.
Now moving on to looking at the draft trends, I want to start with the big discussion this year, size:
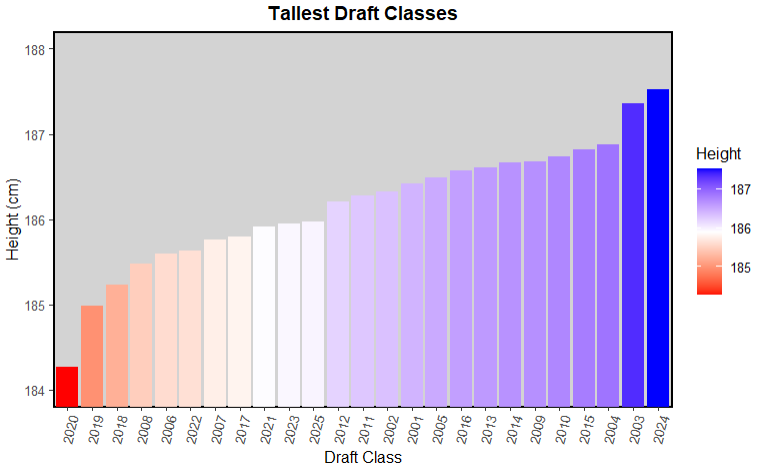
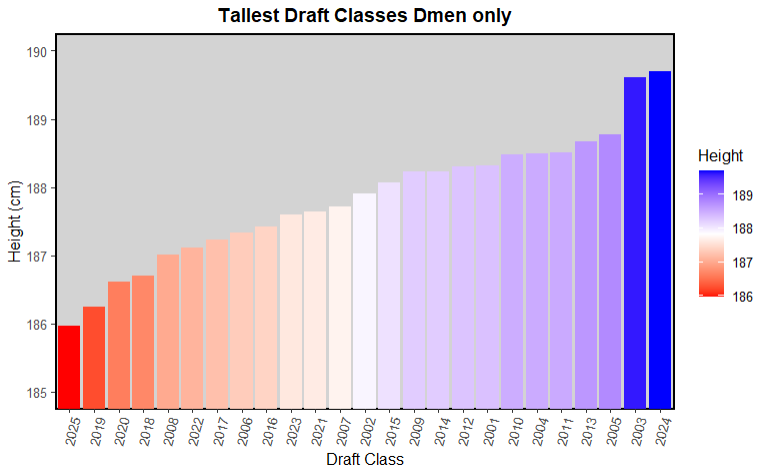
In terms of height, this draft class was only average sized overall. However, all of the discussion was about how there wasn't a single d men drafted that was under 6 ft tall. While there wasn't, there were also quite a few drafted at just over 6 ft, and not a ton drafted that were above like 6'6, as far as I can remember at least. However, both of those rankings will likely climb a bit in the coming years. While most players are close to fully grown at 18, it is far from unheard of for a player to grow an inch or two over the next few years after getting drafted. If only 10-20 guys grow by 1-2 inches, then this class shoots right up to the average height since 00. All the other heights were taken from EP in 2024, not at the time of the draft which would be a more fair comparison. Especially considering NHL size measurements are usually more accurate/updated frequently, though they tend to skew high because NHL teams do love their size. Also, FLA caused more of a height boom last year, wow.
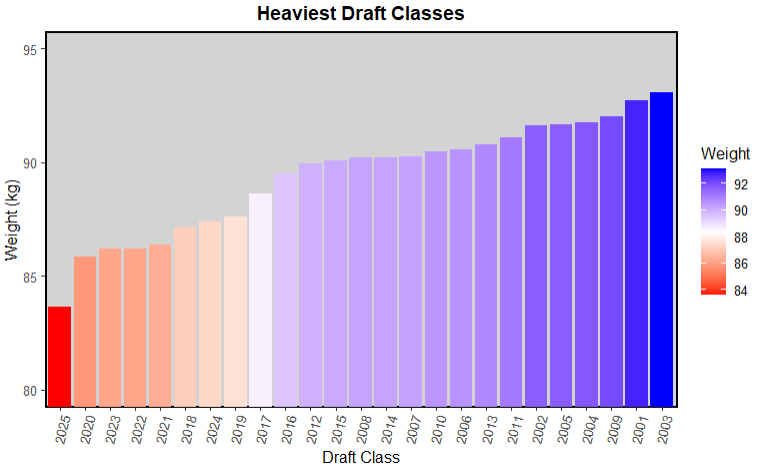
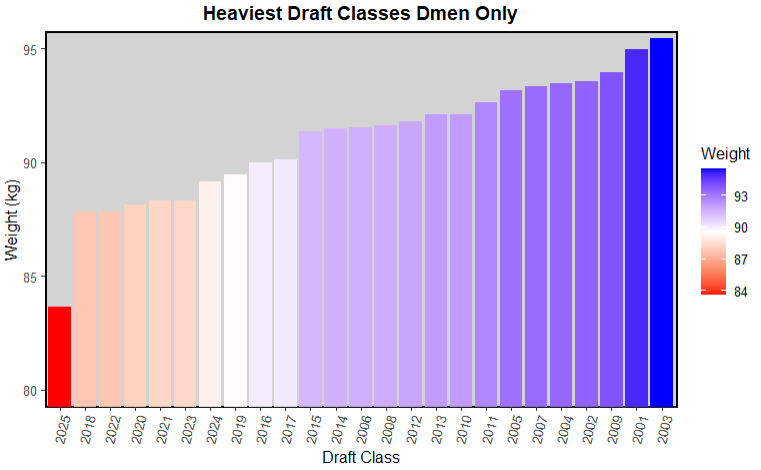
Then looking at weight, the early 00s fill up most of the top of the rankings, which shows what the league favored when those players were coming into the league, size and strength. Then all of the most recent classes are at the bottom, likely because the players haven't had time to fully develop yet, and put on muscle in an NHL weight room with NHL training standards. It is fully expected for most of these players to put at least 10-15 lbs on before making the NHL, if not more.
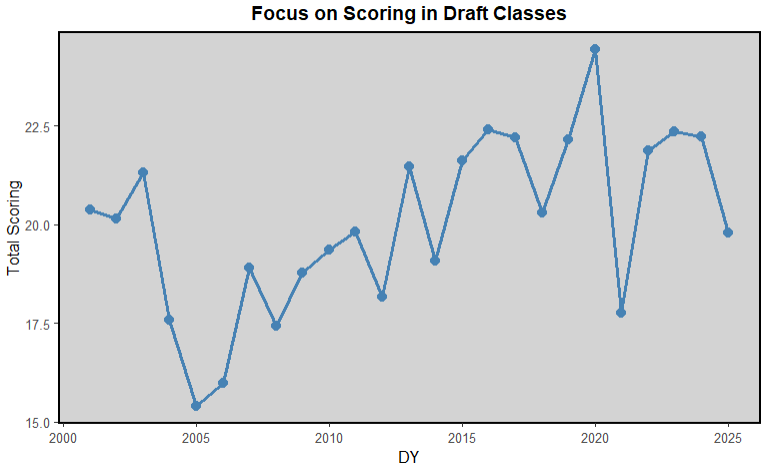
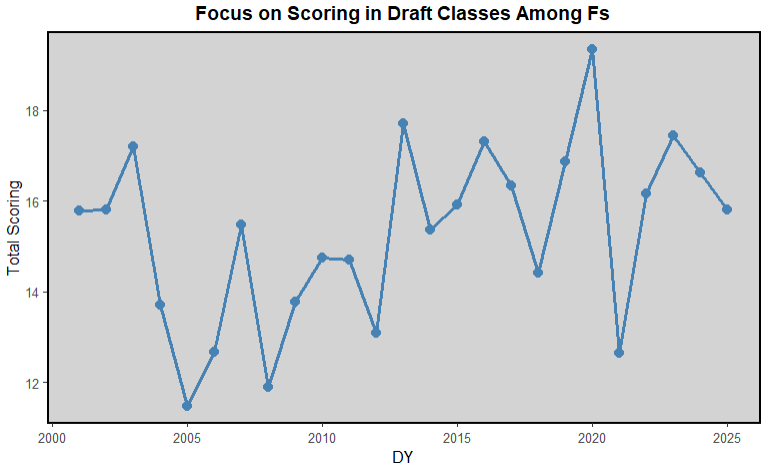
Next, looking at scoring, overall you see the sharpest drop in 2025 that wasn't from a year where the number of players picked dropped, or didn't play (COVID/2021). Then you look at the Fs only chart and see that most of that drop came from dmen. That was interesting, because historically defensive scoring is the worst predictor of future NHL success than any other commonly used stat (is still the best we have, but not great). However, defensemen who didn't reach a certain threshold in scoring have almost never made it because that shows they do/don't have the minimum required puckhandling and vision to simply get pucks out of the defensive zone in the NHL. It also made total sense seeing how many large DFDs got selected from the early 2nd through the mid 3rd, which is usually where teams tend to swing on "high upside" Fs that fell out of the first because perceived risk, however there were very few of those types of players this year. Also interesting seeing a steady upward trend in overall scoring until this year, then 1 somewhat clear jump after the 2012 lockout in Fs only scoring, until 2 consecutive decreasing years in 24 and 25.


Next, looking at scoring, overall you see the sharpest drop in 2025 that wasn't from a year where the number of players picked dropped, or didn't play (COVID/2021). Then you look at the Fs only chart and see that most of that drop came from dmen. That was interesting, because historically defensive scoring is the worst predictor of future NHL success than any other commonly used stat (is still the best we have, but not great). However, defensemen who didn't reach a certain threshold in scoring have almost never made it because that shows they do/don't have the minimum required puckhandling and vision to simply get pucks out of the defensive zone in the NHL. It also made total sense seeing how many large DFDs got selected from the early 2nd through the mid 3rd, which is usually where teams tend to swing on "high upside" Fs that fell out of the first because perceived risk, however there were very few of those types of players this year. Also interesting seeing a steady upward trend in overall scoring until this year, then 1 somewhat clear jump after the 2012 lockout in Fs only scoring, until 2 consecutive decreasing years in 24 and 25.
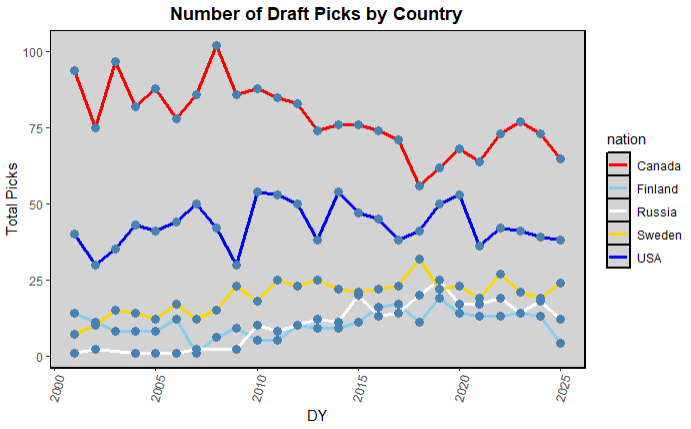
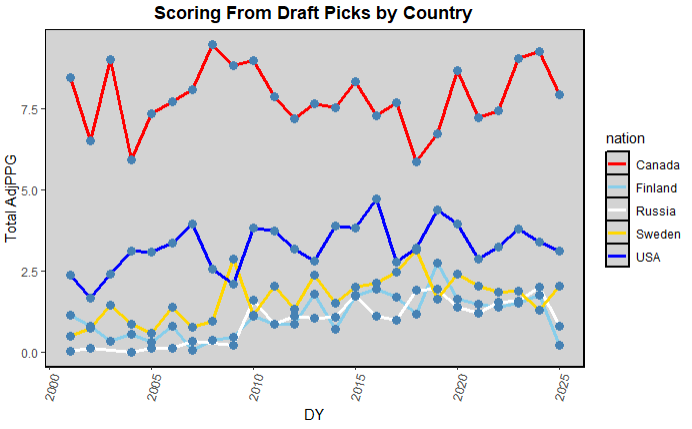
I also wanted to look at how the NHL has drafted from certain countries over the past quarter century. O was expecting a sharper drop in Canadians correlating with the drop in Canadians in the NHL, though I suppose that happened mostly before 00. I like seeing the slow and steady climb in Russians and Finns, then the shop drop this past year in an incredibly weak class for both of them. Will be interesting to see how they bounce back in 2026 and moving forwards. I think Russia will likely bounce back and be fine, but Finland has been relying on an insane development system to make up for their small population base, but now they also have to contend with an incredibly odd and un-translatable systems in Liiga. Scoring generally correlates with number of picks pretty tightly, except with Canadians and the occasional year in Sweden that peaked in one but not the other.
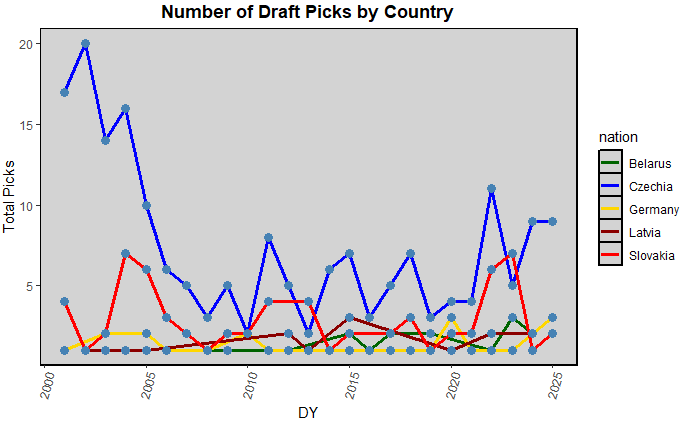
Then looking at smaller nations, we see a massive fall off after the early 00s in Czechs that are only starting to come back now. Slovakia remained consistently inconsistent having a few strong years then a few poor years, which makes sense to what I hear. Every few years there's another class we hear about being the next "golden generation" of Slovaks, but then the next class or two after that will have 2-4 players picked. Then Germany, Belarus, and Latvia are all consistently getting 0-3 players picked every year, usually having at least one selected though.
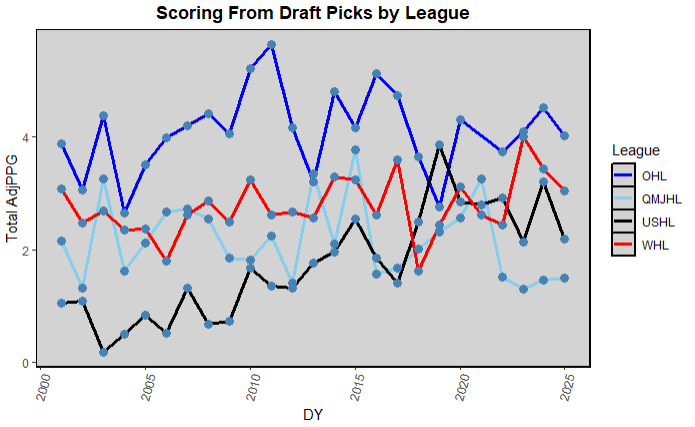
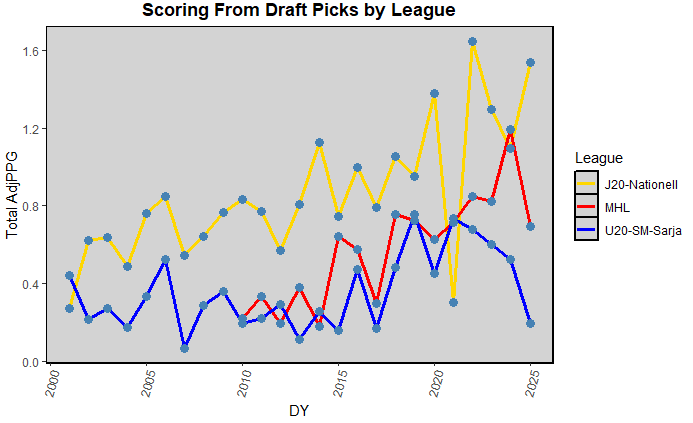
The final thing I wanted to look at was how scoring and draft class strength depended on scoring in each league. I started by looking at scoring in each league over the years. Aside from the plummetting USHL over the last 4 years, the 3 Canadian junior leagues have been somewhat consistenly random over the past quarter century. The OHL was generally the "best" league, but one year really could never be used to predict the next. Then you do see a somewhat consistent increase in USHL scoring, which tracks with how the public has changed their views on the USHL over the past few years. You can also see the absolutely LOADED 2019 NTDP class carrying the 2019 USHL draft class to be the strongest junior league that season. Then with the European leagues, we see a steady increase in scoring for basically all of them except the plummetting MHL this year and steadily decreasing Finland U20 over the past few years, showing thar Liiga or other leagues has been carrying them the past few years before this year and/or they haven't been able to bring in as many imports the past few years.
I then wanted to use the league scoring in each year to try and predict the overall strength of the draft class. Overall strength of the draft class being total scoring. I wanted to see if I could predict that using one or two leagues scoring totals in that class. This could be good for rebuilding teams, because they could target 2026 picks if they see it is going to be a strong OHL class, and that usually correlates with a strong overall class. However, there was no real correlation between any individual league and the overall draft class strength. Anytime there was a strong year in the OHL, it would get cancelled out by a weak year in the Q or in Europe, and vice versa. Then for any of the European junior leagues, I would have had to look at players playing in that nation in general because a strong year for the SHL means that all of the top players have left the J20 leaving that league as one of the weaker ones even if Sweden had a strong year.
Data
I collected almost all of the from eliteprospects. I got all of the points and teams and leagues from EP, then the draft classes I got seperately from EP, and manually put the 2025 class into a spreadsheet as the class was happening and later merged that with the EP stats. I then got all of the rankings for the consensus board by just scouring Twitter and colling all of the publicly posted rankings that I could find. I also had to go to TSN or EP Rinkside, or dobber or whatnot for the rankings from specific outlets.