Overview
Along with collecting the actual rankings from the EP draft guides, I also collected the skill grades, and actual reports because I was planning on looking at how each of those correlated with future player success.
My logic for how I'd do this was pretty simple, at least to start. For the skill grades I wouldsimply build a regression model to look at how well correlated they are to DY+N league adjusted scoring. Again, I know scoring and bointzzz isn't the ideal target, but it is the best stat that we have and still more predictive than basically anything else available to the public.
For the next part, I didn't necessarily have a perfect idea of where to go. I knew I wanted to do some natural language processing with the reports to see if how scouts talked about players could tell us more than just a simple ranking. I'd previously done projects where we looked at how similar certain works are, and some sentiment analysis on reddit stocks data for classes. Unfortunately I figured sentiment analysis would be useless, and I tried it and was right, with all the hockey slang, and scouts not wanting to trash on 17-18 year old children, it makes sense that there was not much distinguishing players with a sentiment analysis. I was able to use the similarity scores, which I created by looking at the 10 most frequent words used in each article that weren't "common" words (and, the, or, but, not, etc) or the player's name and compared those and their frequencies to the 10 most commonly used words for all other players. I could have probably done more than 10, but once you go to using the whole report for a player, you start seeing words only once, and I don't think those can tell us much, and the proportion of words used once relies heavily on the length of the reports, which changed throughout the years.
Finally, I was able to work with some individual phrases to see how well each of them correlated with a player having success. I had never done anything like this before, so I looked at a bunch of common combinations of 2-4 words, and manually selected some that I thought could be good indicators. I tried mostly limited it to phrases like "make play" that clearly relate to something hockey related, but also that didn't account for phrases like "make a play", or "made lots of plays" which have similar meanings, but wouldn't have gotten picked up on in this model. I then used 40-50 or so of those phrases and looked at how often they were used and how well players who were decribed using those phrases scored in their DY+3s. I then ran a regression model using the number of occurances of each of the phrases as the predictor, and DY+3 league adjusted scoring as the target. That model ran shockingly quickly, and produced decent results that I'll discuss more in the following section, but I was expecting that model to take ages to generate and run which is why I limited the number of phrases. Now I want to try it with every phrase that occured more than, say, 10 times, but I have yet to do that. I also used just a simple linear regression model to look for statistically significant phrases, but I think it would have been better to run a LASSO regression model that could zero some of the coeffecients.
Results
The results for the skill grades were pretty simple, and somewhat consistent across most of them. There was a slight positive correlation with the grade and DY scoring, as you would expect, the players with the higher ceiling are also better in the current moment. Then there would be a stronger correlation between the grade and DY+2/3/4 scoring, then almost no correlation with DY+5 scoring. I noticed while collecting the grades for the DY+5 evaluations (only 2020, so far) that they were usually much higher, and more random than the rest of the years where they remained more consistent. I also had that confirmed to be that their methodology wasn't quite set in 2020, so using those grades is not necessarily ideal. But anyway, here are the resulting graphs from each of the grades, starting with skating:
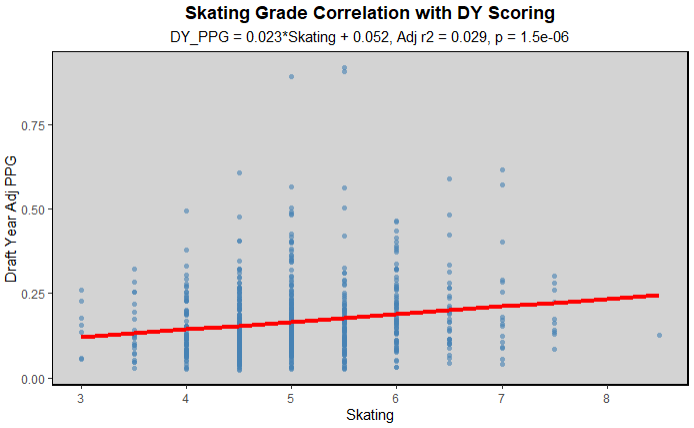
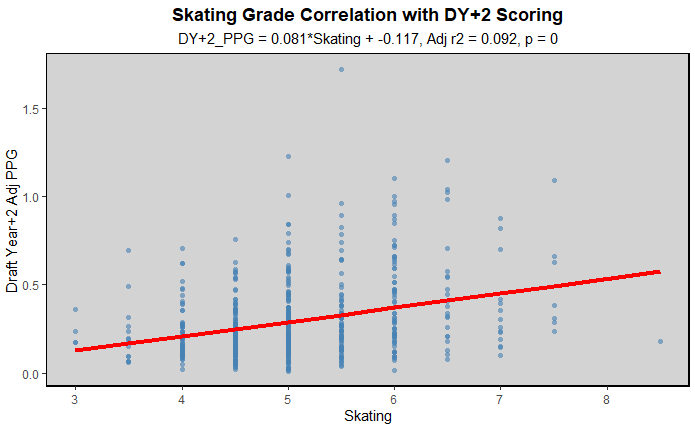
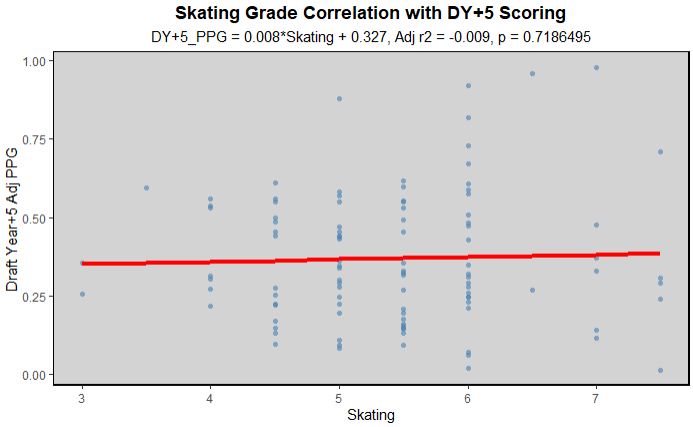
Skating did meet the trend of there being a smaller correlation between the skill and DY scoring, then larger correlation as time went on until looking at only the 2020 class. Now the correlation between skating and scoring is lower than other skills, I think, because skating is another obvious tantalizing skill like size, people look at it and see stars, but in reality you need enough other skills to go with skating. Not that it's bad to take a late round flyer on a guy who can only skate, I would much rather do that than take a guy who is only big, but it's not a way to surefire successs. For every incredibly talented Connor McDavid, there is a Kasperi Kapanen, Andreas Athanasiou, or Antonio Stranges, not necessarily bad players, but they are clearly far better skaters than anything else, and are not impact NHLers because of that.
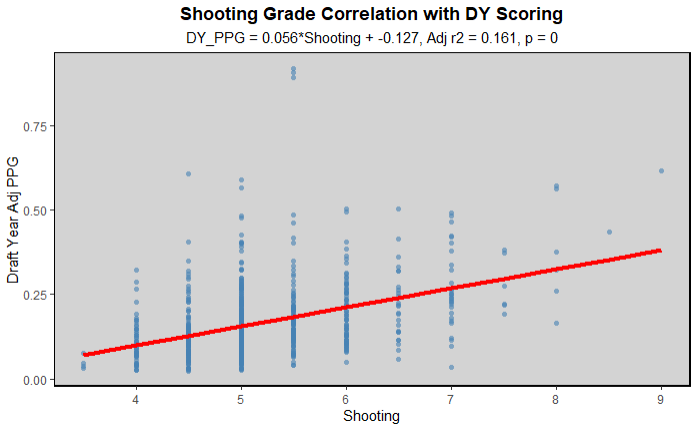
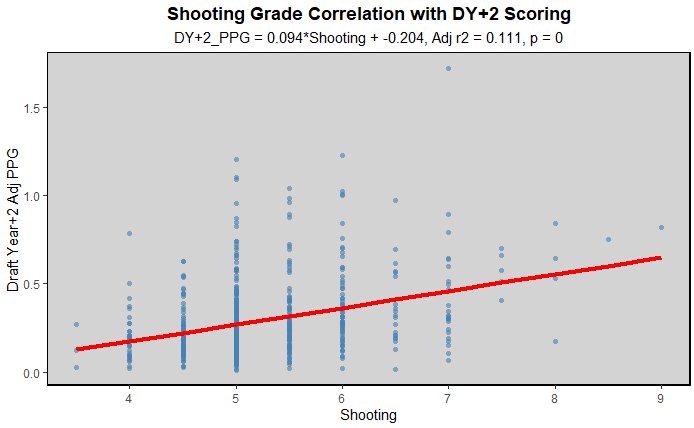

Shooting grades follow a slightly different trend, that their highest correlation with scoring is during the DY and they go down year over year, until there is basically no coreelation from the 2020 class. Again, that was because their methodology wasn't set yet, so there is still certainly some correlation between long term scoring and draft shooting grade. But this also makes sense, because unlike the good skaters who work on the rest of their skills and increase their scoring by increasing their all around game as they get older, shooters I feel like are usually told to keep shooting. They will keep shooting and working on their shot and scoring more, until they reach pros from juniors, or the NHL from the AHL, and all of a sudden the goalies are all much better and they can't rely on just their shot anymore. Then they either sink or swim, they work on other ways to score and keep up and become great players, or keep trying to beat goalies from the outside, and doing what worked for them in juniors and struggle at the next level. That is why I'm always warry of pure shooters, after getting burned by Alex Holtz, they're not super common, Cole Eiserman is the closest I can think of off the top of my head, but I think this trend backs up my opinion to be warry of those types of players.
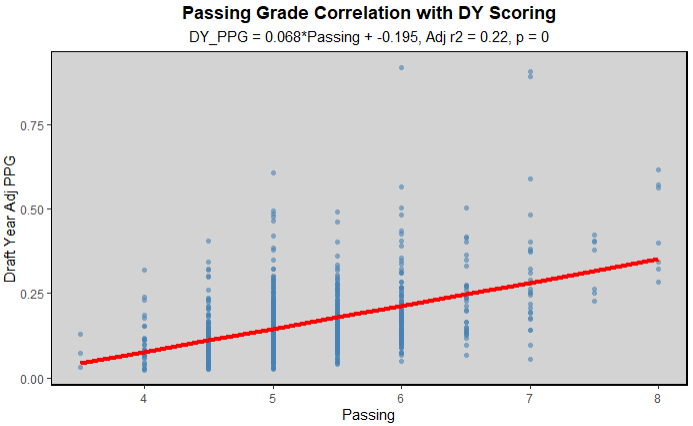
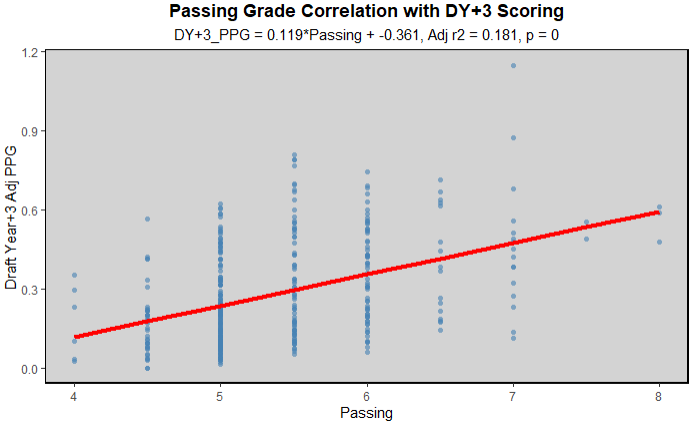
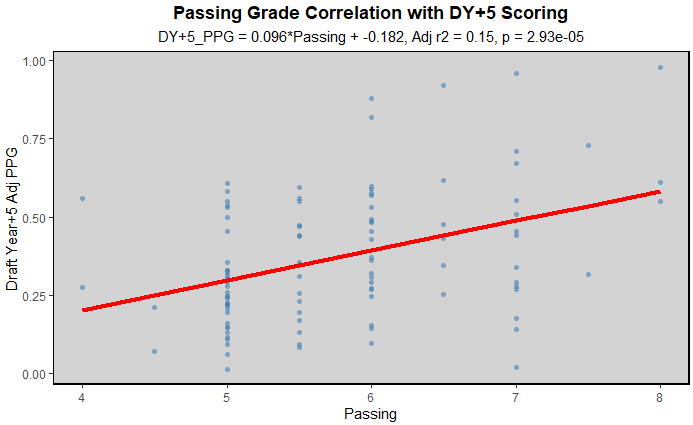
Now for passing, it follows the trend that DY+2/3/4 have the strongest correlation with scoring, which again, makes sense. The best passers are more likely to score more during the season relative to the best skaters, unless they just have no linemates around them to help. Then as the years go on, passers develop more of their all around game, and find it easier to adjust than shooters who have to just beat the goalies. Then passing is also more directly tied to scoring than skating is (ie a good pass can lead to a goal, but a good skate needs something else to lead to a goal), so it makes sense there why it is more correlated to scoring than skating.

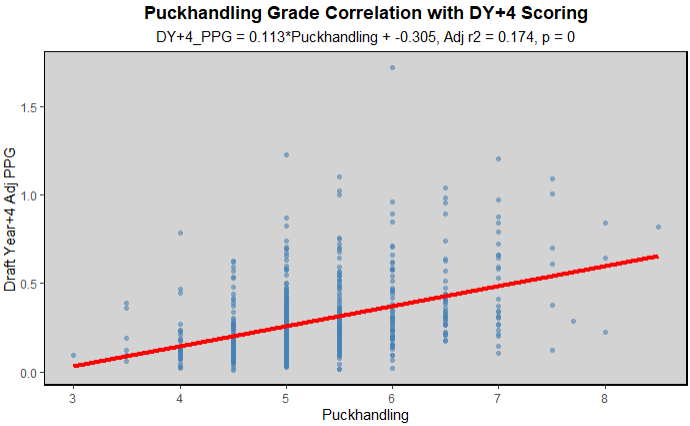
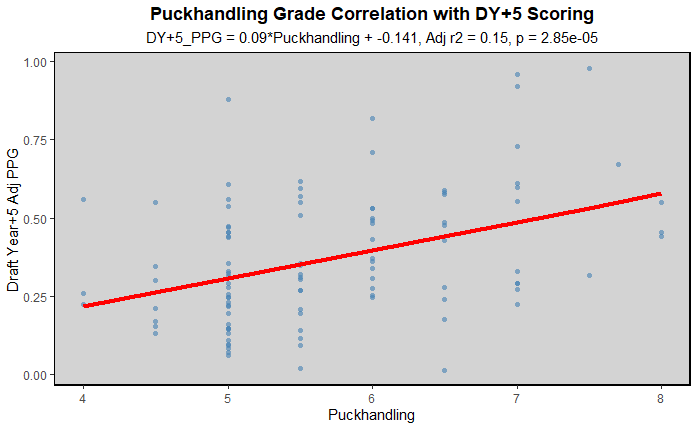
Puckhandling follows a similar trend to passing, which kind of surprised me. I was going to assume it would be more similar to skating as a "secondary attribute", but it had noticeably stronger correlation with scoring than skating. I guess the ability to dangle around players will consistently get you, and your teammates more chances, and if you come out of more 50/50 puckbattles because you can stickhandle in a phone booth around the defender, that is anohter way to directly help your team and consistently get good scoring opportunities. It is also easier to grade good stickhandling than looking at the fine details of a player's stride in my opinion. Not necessarily saying that the EP scouts don't know what they're talking about with skating, but each scout could have slightly different priorities when it comes to ankle flexion, hip use and agility vs just raw top end speed. While stickhandling can almost universally be evaluated as that boy don't loose the puck. Like ever. And there will be more consistent and accurate grades.
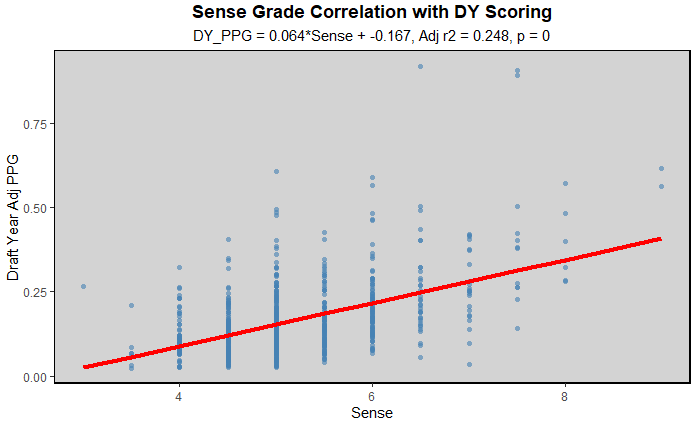
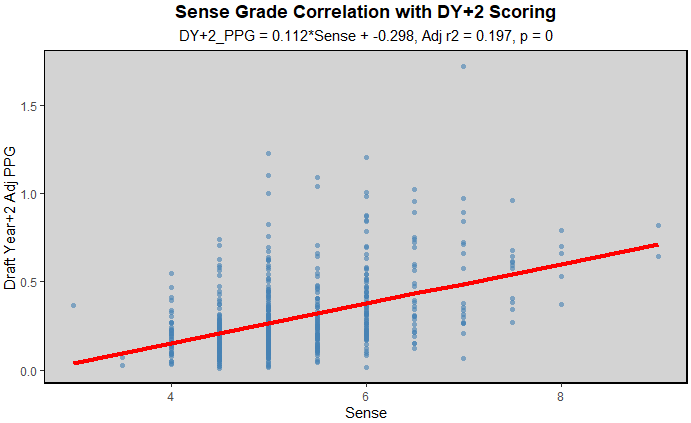
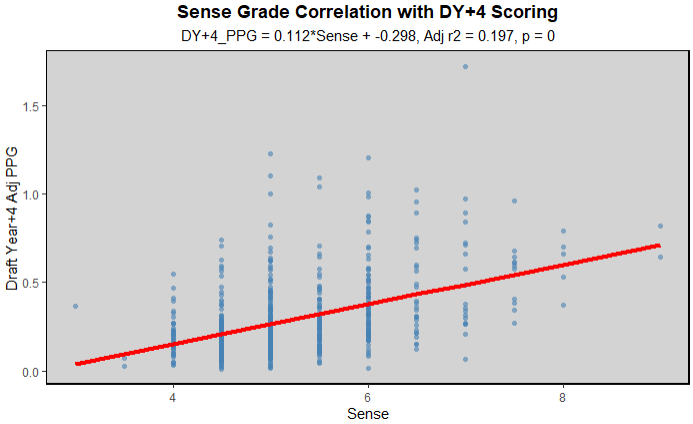
The sense grade didn't follow the same trend, where it peaked a few years after the DY, and graded poorly in DY+5 because of the system not being set yet. It stayed relatively consistent throughout, only dropping a bit after the DY, and I believe that is because hockey sense is kind of just a catch all stat. If you ask 100 different scouts what their definition of hockey sense is, you'd get 100 different answers. SO I think it has always been viewed as a catch all grade, the scout doesn't necessarily see a great shot/passing/skating, but there's some reason they like the player, so they give him a high IQ grade. It could be a bit of luck, good linemates, great vision, or actual great hockey IQ, whatever you define that to be. I think that also explains why it drops off a bit after the DY, there is an inherent bias towards scouting players who score a lot, so if a few of them just got lucky/paired with good linemates, their sense grade may be bumped up because the scouts didn't really know what else to grade them out as. Then when they ran out of luck/got new linemates their scoring dropped. I'm not saying that is a common phenomonea, but if something like that happens a few times a year, it will drop the corerelation between scoring and sense grade a bit. Then it also probably didn't drop in the DY+5, because while the way they measured and graded things was different for that season, what sense was, has kind of just changed to fit the description, I feel like it is more just a whatever else hasn't been graded stat.
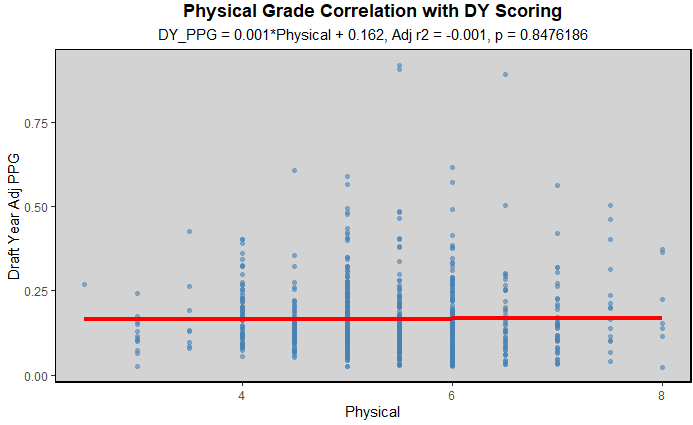
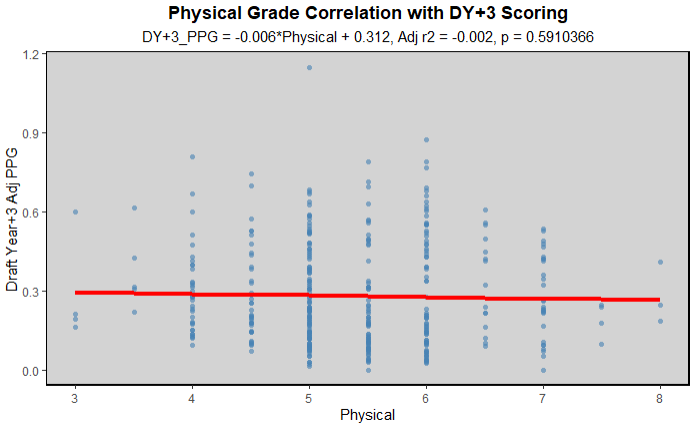
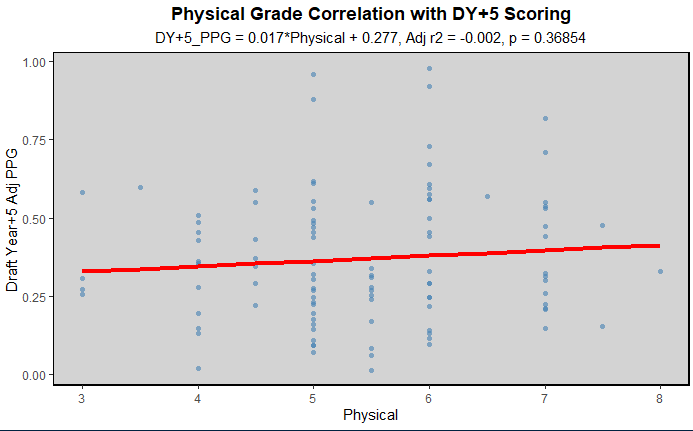
While inputting all of the physicality grades into the spreadsheet I used to track all of these, I kept laughing at the amount of times a report was basically just "yeah, this player can't skate, shoot, pass, or do much of anything else, but he's huge and hits well": D grade. So it was rather predicable that the correlation between scoring and the EP physicality grade was almost zero. Obviously physicality is useful to have, and guys like that get drafted for reasons totally opposite to scoring. While that wouldn't be my strategy, I understand why teams do it and thus, why those players get graded in the draft guides. And again, at the top of the draft, if you're looking at the 5'10 skilled winger, or the 6'6 big powerful C with very similar skill levels, yeah, take the more physical one, there is absolutely value to being a physical, tough to play against player, once you have the requisite skill to actually be a threat to your opponents losing the game. Most of the guys in the later rounds that get picked because of their physicality don't have that skill, and I simply wouldn't draft them if I was in charge of an organization.
Now each of those skill grades was not particularly great at predicting future success/scoring alone, but combining them together I thought could potentially lead to a decent draft model. The best model I was able to make, to predict DY+4 scoring (didn't want to rely on just 2020 data, probably should have/will, if I can find the data again, make a model for DY+3 without any of the 2020 data) had 4 statistically significant coeffecients, skating, shooting, puckhandling, and sense, with coeffecients between 0.037 and 0.042 (predicting NHL equivalent PPG, so small coeffecients makes sense) except for sense at 0.064. The intercept was -0.67, so players needed to be above all 4 grades (very very low) to be projected as having 0+ points, which makes sense, you're always going to have some nonsensical results when using linear regression with bounded outcomes, but for most players with grades between 4-7, the model makes sense. I was initially surprised that passing was not in the best model, but looking at all the others, it seems to be somewhat correlated with puckhandling, which seemed to get all of the credit, and left passing as never statistically significant. The biggest weakness of this model, in my opinion is how EP grades players ceilings. They gave all of the top end players solid ceilings, 6s, 7s, maybe some 8s depending on the player, but after that, because they were grading ceilings, not current ability, the vast majority of their C and below graded players, and even some Bs received mostly just 4s and 5s with maybe a 6. That makes sense to not write any players off, but I feel like giving them a likelihood at reaching that ceiling, or some other indicator would have been helpful. Because, while Cooper Simpson might have had the same ceiling as a Ville Koivunen, it has always been clear that one player is far more likely to hit that ceiling than the other.
I also wanted to look at the tracking work that David St. Louis, and Mitch brown had, to see how well any/all of those stats could be used to either help an NHLe model, or at least predict furute scoring. Unfortunately those stats only started appearing in the draft guide in 2023 I think, and in different versions in each of the subsequent guides. They also weren't on every player, so I didn't want to use them, but give it a few more years, and I would love to test those data points. I love having more data, whether it is useful or not, at least the option is great to have
The next thing I looked at with this data was creating a similarity matrix, to figure out which players over the past few years were described the most similarly to each other. There really isn't much analysis, I described how I built this model in the overview section so I can now share the player card/graph I made from this:
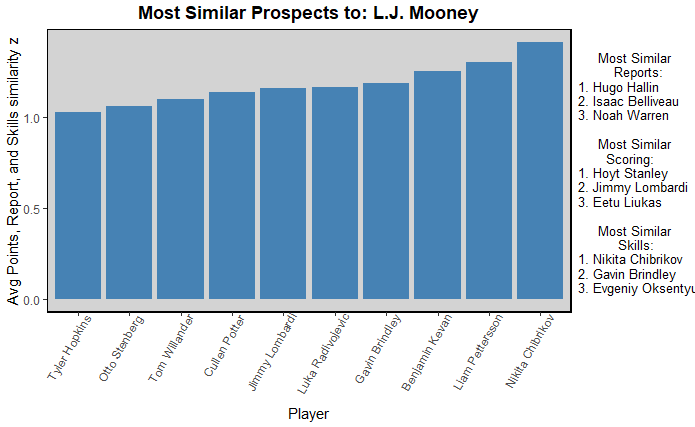
The main graph in the middle shows the average "most similar players" to Mooney. I had three main inputs, the report, where I described how I calculated the similarity score above. Then the skill grades score, that basically just looked at how far apart each skill was from what Mooney's grade was, then averaged those. Then scoring was simply the closest league adjusted scoring rate players in my database. I then calculated the z scores of all of the metrics and averaged them out. Because they were all distance matricies, not actual similarity scores, the higher numbers were further away and thus less similar, but the lower numbers, closer to zero, were more similar, and had negative Zs so I had to multiply the z scored by negative 1. Then on the side of the chart you can see the most similar players in each individual metric, just listed. I quite like these charts, I think they give good context from a variety of sources, however I didn't want to make them public because I used the EP reports and draft grades, which are behind a paywall.
The next thing I did was look at which phrases corresponded to players scoring more a few years later into their careers. The results are below, and are kind of hard to make sense of:
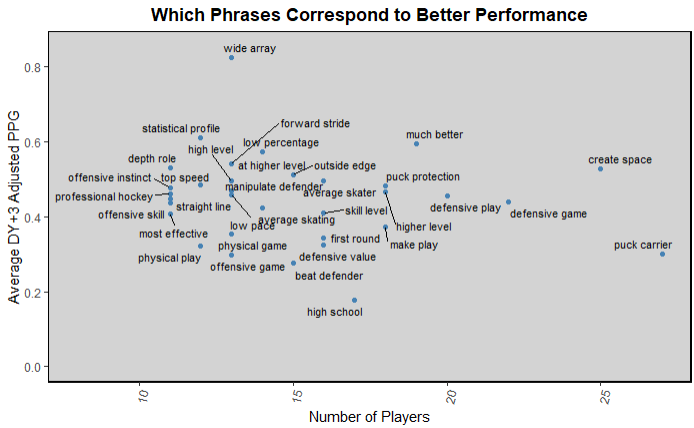
Seeing "wide array" at the top was quite interesting to me, like it makes sense that having a wide array of tools is useful, but more than good "puck protection" or "offensive skill". Though I suppose those phrases could have been used in a negative light as well, depending on the context around the phrase. Seeing high school at the bottom didn't shock me, it was bound to be mentioned in every HS player's report, and the vast majority of HS players end up never making it. Then the rest of the phrases are basically just clumped in the middle of "idk what to do with them" or "lacking more context" which I think I can work on when I decide to revisit these models. Also, there were other phrases I looked at that had a lot higher sample size, but I had to cut them out of the graph to make the ramaining phrases legible.
I then created a regression model to predict the future scoring of players using all of the models, but that ended up not working too well. Just aimple linear regression gave all of the phrases a weight, but very few were statistically significant. The only ones that were, to any degree were defensive end and defensive zone. Both of which had negative correlations, which is unsurprising given prospects need to score to be successful in most cases, and defense first players tend to not score much, even if they become successful at the next level.
I later decided to fix my model, and ran a LASSO regression on the data, which allows for coeffeients to be 0, which we desperately need in thsi modelling process. I then used that model to predict the 2025 NHL draft, with the following results:
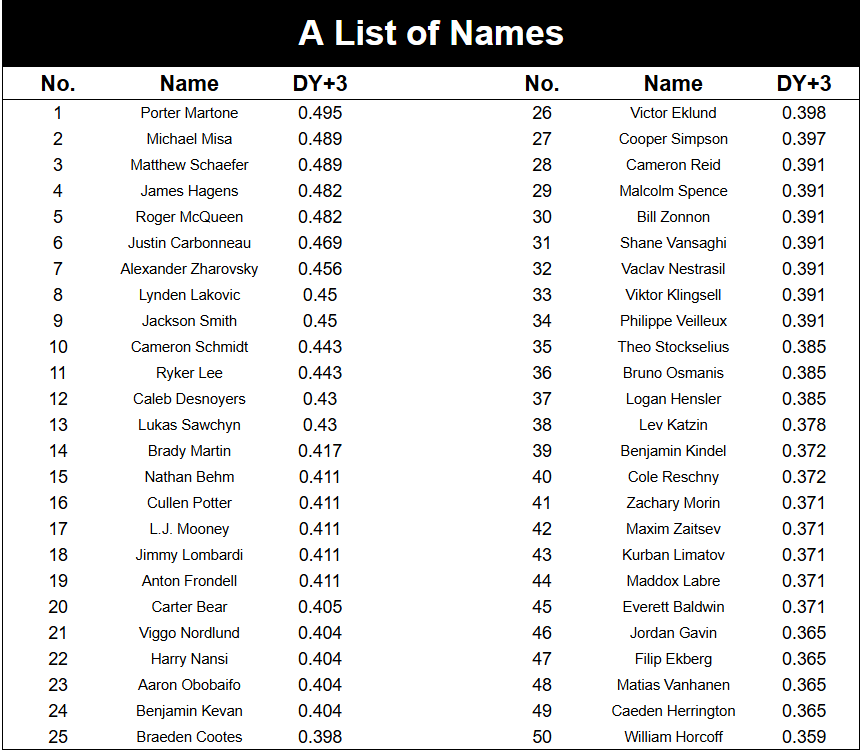
Obviously this is a wild list compared to consensus, but considering it only looked at certain phrases used in one outlets scouting reports. No heights or weights, no scoring, no other rankings, I think it turned out remarkably well. We'll obviously have to check back in, in a few years to see where things stand, particularly some of the bolder calls. The top 3 being Martone/Misa/Schaefer was surprisingly impressive to me, I was saying all year I think the gap between the top 4 (those 3 and Hagens) is far smaller than most are saying. Then Zharavsky at 7 makes sense, they were describing all of the silly things he was doing the in the MHL east silver division, which the model had no way of knowing. Then Ryker Lee just outside the top 10. I loved Ryker Lee all year, maybe not quite 11 high, but it will be interesting to see how he pans out. Nansi and Osmanis at 22 and 36 respectably was interesting, both of those guys were intreguing to me, but not to that level for sure, but once again, we'll see in a few years. I also liked the Everett Baldwin love, which is looking to give solid ROI to early investors based on this preseason so far. As I said earlier, I am very pleased with this model and can't wait to build on it next year, with more data and a better understanding of my computer's processing power when it comes to things like this.
Data
This data was almost all entirely from EP premium/rinkside. I downloaded all of the draft guides and put all of the reports, grades, and rankings into a large spreadsheet that I then began looking at in r for this project. Also, as usual, the poits aspect of this data simply came from eliteprospects.