Overview
Getting back to what I like doing: trying to predict the future!!! I built a few different models to rank the 2025 NHL draft class. The first was the eliteprospects report textual analysis rankings which I described in the EliteProspects NLP section. BUt to quickly recap, I picked 50 or so different phrases to see how well they correlated with future scoring. Then I trained a linear regression model on the 2020 and 2021 draft classes to figure out what phrases were actually important to being able to predict future scoring. I then ran that model on the 2025 draft reports to get a top 50 list.
Then on draft day, I also made/finished up 2 more draft rankings. The first was a more detailed public consensus board. I simply spent like an hour or two a day, for days leading up to the draft browsing twitter and instagram looking for any new draft rankings that people published. I put all of them into a spreadsheet, cleaned up all of the names, and created an average ranking for all 442 players that were ranked. I also "punished" players that were not ranked in outlets by adding 1/2 the players ranking to the number of players ranked by that outlet. So for example if a player was ranked by 52 of te 53 rankings I tracked with an average rank of 100, and the 53rd site ranked 100 players but didn't include that one, I would have put the estimated rank down as 150 and recalculated the average. However if the 53rd outlet only ranked 32 players, I would put the estimated rank down as 116 and recalculate. I also did this step all at once for every outlet that didn't rank a player, so if a player was only ranked 1 time at 150th, I calculated the estimated rank for all the other rankings (150+1/2*32, 150+1/2*64, 150+1/2*100) then took the average of all of the new rankings.
The second ranking I built on draft day was a (rushed) very standard NHLe/draft ranking model. Since I already had my league scoring equivalency model, I was able to simply make an adjusted scoring rate for every player. All that did was translate their 100 points in the OHL to ~20 points in the NHL, or their 12 points in the SHL to ~9 points in the NHL. Then I took those scoring rates, combined them with a few other inputs like height, weight, bmi, and age relative to the rest of the class, and the league they played in, to create a logistic regression model to predict the likelihood that each player becomes a star, a top 6 player, or simple NHLer. Now to define "Star" players, I looked at EVO, and required a player be top 20% in EVO for 3 consecutive years. I used EVO because I feel like it is more repeatable than EVD or other WAR components, and generally correlates better to who the public considers "stars". Like who would most people say is better, a guy like Logan O'Connor, or Macklin Celebrini, both had the same WAR, but one was modtly in defense while the other was in offense. Also just in generl, I don't necessarily trust who gets credited with causing the decrease in shots and xG against in some of the models. I agree that they are the best things we have for evaluating defensive play, but I dislike using them in rankings, or as targets for something like this when we have more stable offensive metrics available. Also, I generally think getting good offensive players is harder to do than good defensive players, which are more a product of the system and just pure effort. That makes offensive players more valuable, even if they may have a slightly lower overall impact on the game. Tehnto determine top 6 players I used total time on ice, marking someone as a top 6 player if they were in the top 7 Fs for TOI on their team (injuries, I figured I'd add a 7th), or top 4 d men. I like using WAR, and rate stats, but if you can never get a coach to trust you, your impact on the game will be limited, and also I just feel weird calling guys like Daniel Sprong top 6 Fs, or stars because that's how they grade out when they never get the ice time to actually show it. Also, we don't know if a player has the stamina to have a high impact for 20+ mins a night if they never do it. It's a different mindset going out on the ice knowing you'll have a nice long rest after you get off vs worrying you'll have to hop right back over the boards, you can go more all out each and every shift. Finally, for NHLer, I just limited it to 20+ games with positive WAR for 3 consecutive seasons. I don't want to call someone an NHLer (in a model) if they only played a game or two, or even 1 season. And I also don't want to call them an NHLer if they just got playing time because the team was bad, or they were a good leader or whatever, and their talent could have easily been replaced by any random AHL call-up.
When building that model, I created seperate logistic regression models for each of the targets, NHLer, Top 6er, or Star, and for each position, offense and defense. I also used the two unique factors in my model of league and bmi, that I don't think anybody else has used before. Bmi is a simple one, I just have noticed that more physically deceloped players tend to have lower ceilings than their cohorts who still have to put on size and muscle before making the NHL. Guys like Sam Poulin were physically dominant, and just stronger than their opponents in juniors, but when it came time to make the jump to pros, they usually can't outmuscle their opponents as much anymore and either have to adapt the rest of their game, or settle into a bottom 6 role. Their size and strength could also give them more opportunities to play up at higher levels when they're younger, which may not be best for their skill development at that time, and they stagnate in certain roles. Now for using leagues as a seperate input despite already "accounting for" league strength in my adjusted points model. I have always had a theory that standard NHLe models undervalue certain leagues, most notably European pro leagues, when evaluating draft prospects, because it is very hard to get ice time in those leagues. Take Brad Lambert for example, he didn't score much in his DY, and the models didn't like him, turns out, they may have been right in his case, but we'll see on that. Would it have been better for his development if JYP had sent him to their U20 team for the full year instead of giving him minutes in Liiga, probably not. Say he scored at 1.75 PPG in the U20-SM-Sarja, pretty high, but not unreasonable considering he probably would have gotten all of the ice time, and all of the best linemates, and had already spent a lot of time in Liiga. That would have increased his league adjusted scoring vs what it was in Liiga, but probably hurt his development overall. So initially I wanted to make seperate models for each league, but I decided on just including league as a factor for each player in the logistic regression model in r. I also selected the league that the player played the most games in as their league, which isn't the perfect way to handle players who played in multiple leagues, but it was good enough for my 1 day model build.
Results
The first rankings I want to talk about are the ones from the NLP I did with the eliteprospects data:
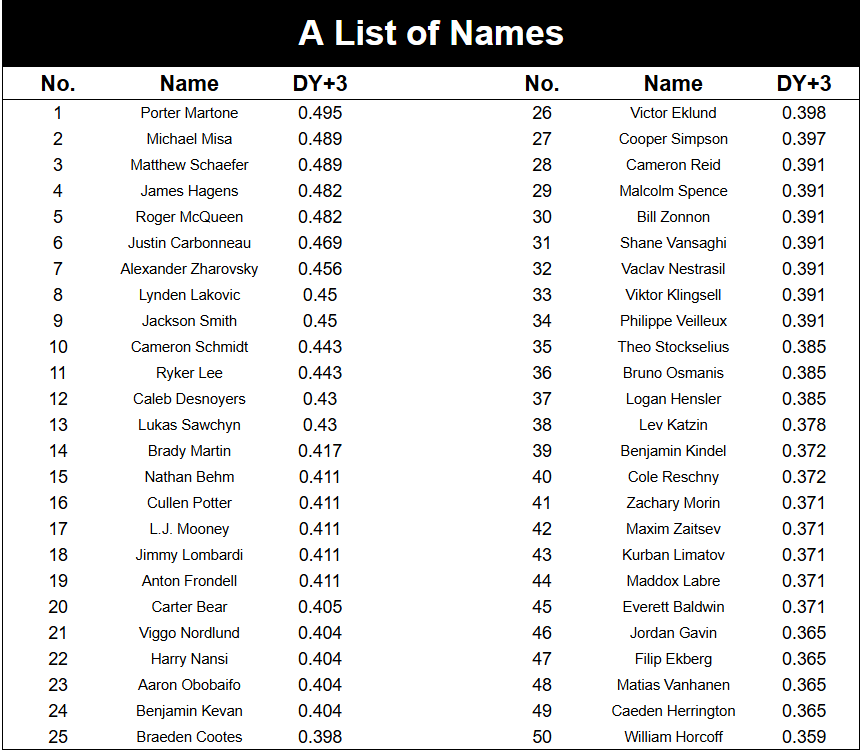
While at first glance these rankings look kind of crazy, I think a lot of them are justifiable, or at least easily explained. Martone, Misa, Schaefer, and Hagens I think were closer than some thought, and having those 4 in any particular order wouldn't shock me. Then with McQueen and Zharavsky, they're both high upside players with one huge risk (back injury or incredibly weak division) which the model probably wouldn't pick up on because it's rarely mentioned and so rare to occur. Similaryl, Smith, Lee, Potter, and Mooney all higher than consensus because most of the reports when discussing guys like them, high skilled, high risk players, are going to be focused on their many skills a lot more than their few weaknesses. Behm, Lombardi and Nansi, I'm not sure what the model picked up on that made them so high, but I'm guessing for Obobaifo, they really liked what they saw in a game or two, but a small sample led to him falling undrafted. Would have liked to see a team take a chance on him late because his small sample scoring profile is a lot better than most of the guys who got picked that late. Then the rankings look more odd outside the top 25, but that's kind of to be expected, this class as a whole was wide open after the top 25 (even sooner tbh). So for the model to correctly pick up on who the top players were and who a lot of the igher upside guys I thought was quite impressive. As a stand alone model it may not be the best, but if you combine the results from this with a standard NHLe model, I would be interested to see how that tracks, relative to the actual draft outcomes, and the points based outcome. Also if EP remains consistent with their draft guides and we get a few more years worth of data, I think this could be a great tool for modelling future draft classes by itself. Especially if you take into account other factors, like their scoring, or, probably more importantly the height and weight and league of a player, this could be a great model. A blend of NHLe that produces some crazy results, and certainly overates/underrates a lot of individual players (but averages out to being broadly correct) and the "eye test" that struggles with lack of sample size, the skill of the person watching the game, and, probably most importantly, preconceived biases could be a great model.
The next set of rankings I wanted to look at were the consensus rankings I made based off of the 50 some draft boards I found on twitter.
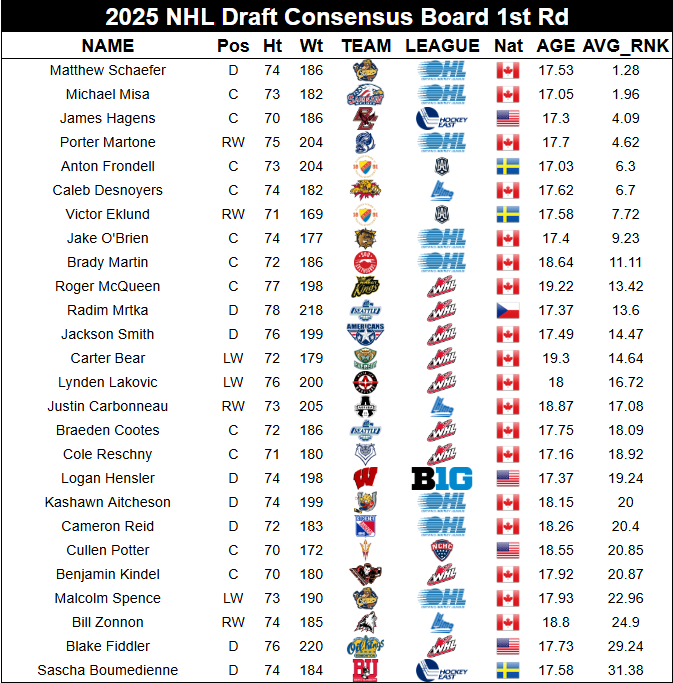
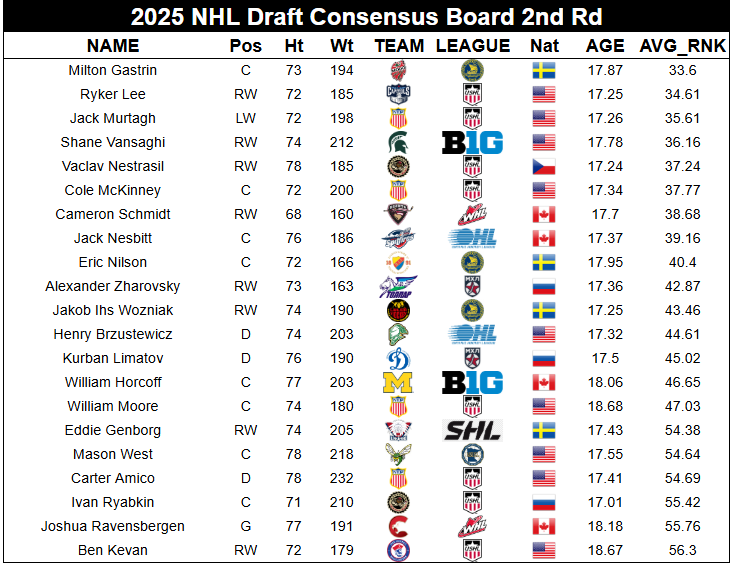
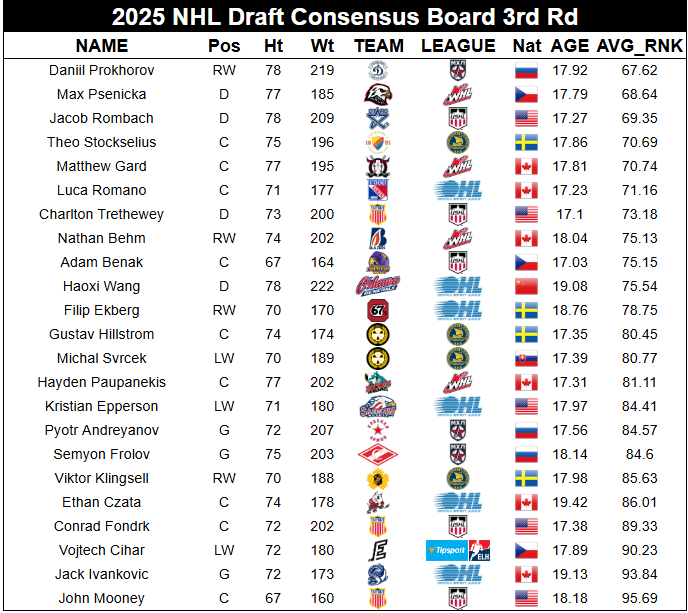
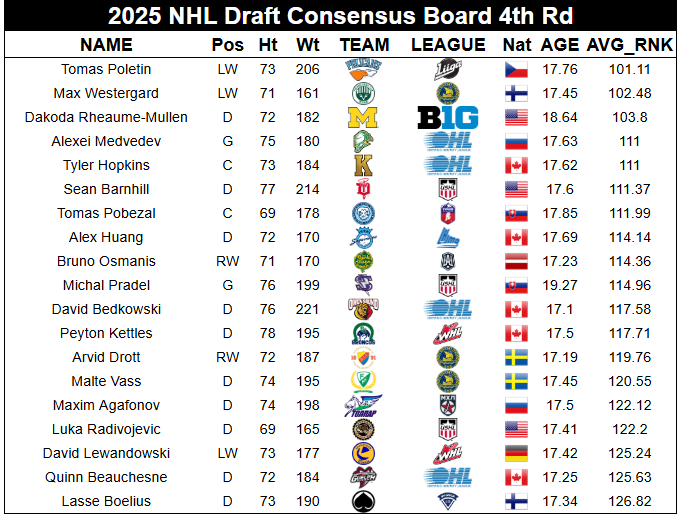
It's funny looking at this because basically my entire commentary is yep, that's basically consensus...! Schaefer Misa at 1-2, then Hagens and Martone a bit after, then Frondell Desnoyers and Eklund, the consensus top 7. Comparing consensus boards to the NFL draft is usually a pretty good model for predicting player successes. Taking the average of many "experts" instead of just one or two. For the NHL draft it will take many years before I'm able to check anything like that because players aren't ready immediately. It's also harder with hockey because in general the evaluations are harder, I feel like there is more groupthink, and it is much harder to find video for any, much less all of the prospects. For all of those reasons, and hockey just generally being much less popular than football, there are a lot fewer rankings, especially those from trustworthy sources, so it will be interesting to see how these rankings stack up a few years down the line. But it was fun to track even in the short term, to compare to the actual draft. Also, yes, there are fewer than 32 players per (consensus) round because the "consensus" rank for players drops because of the way I "punished" them for not being ranked across the board.
The last model/rankings I built was the NHLe, "standard" draft model, that you see, with some slight differences posted by various other people across the web. I like to think mine is unique and different because the way I used leagues and bmi, but ultimately it is still just some combination of points, size, league, and age. There are only so many combinations of those factors, so here are my results:
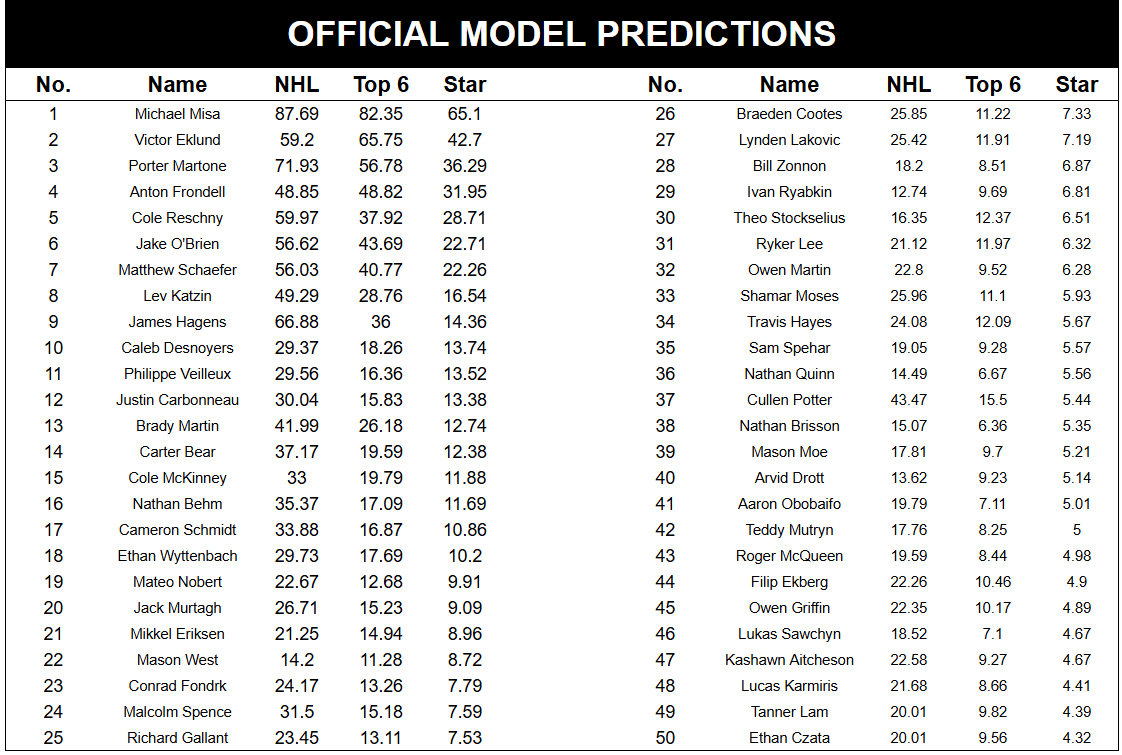
Looking through the model, a lot of the out of place players make sense. Obviously Philippe Veilleux is way too high, but over a PPG in the Q looks good in a model that doesn't raelize how poor the Q has been recently, and he's 5'9. Wyttenbach that high, I liked him in the USHL, but not that high. Similarly, Ryabkin, Spehar were going to be high because the model liked the USHL, and there just weren't many high scoring European players in the class this year. Again with Obobaifo, I would have liked to see a full season from him, or someone take a swing on him late. I remember this model being more chalky than looking back at it now, but it was a somewhat rushed model, so I'll have to look at how it performs relative to the classes I have results for next.
Data
All the points and size nationality and whatnot data came from eliteprospects. I also got the historical draft data from eliteprospects as well. All of the WAR stats came from TopDownHockey (Pat Bacon)/advancedhockeystats.com, as I believe his model is the best publicly available model. Then the TOI data I got from evolving hockey, it was just easier to get from their site than the NHL, NST, TDH, or any other stats site I am aware of.