Overview
The basis of any good RAPM, or WAR model is a good xG model. I had played around with xG models in the past, but my goal in this was to build more models on top of it in the future, so I really wanted to nail it down. I wanted to have a solidified model, that I could test and it would test better than any of the other models I created. As it turns out, a lot of the models I created were very similar and produced very similar results, so I save a few of them to work with.
I started with just a simple logistic regression model to predict the likelihood of a shot going in. All of the data we have sice 07 is the shot location, time, and shot type (snap, wrist, slap etc). I "normalized" the distance to all be on the same half of the ice for my shot maps project, then I took the absolute value of the y coordinate to not have to deal with negatives. This assumes that shots are equal coming from the right side and left side are the same, which from an individual player standpoint isn't true (see Oci's shot map) but as a whole I would assume that it roughly evens out. I also created a time since last shot metric that looked at if the shot was a rebound or not. I figured shots that come within a second or two of another are probably a lot harder for a goalie to stop then the first shot in a sequence, assuming all else is equal about the shot location, type, etc. I made a broad model using various ways to tweak those few variables (mostly just distance squared) and trained it on an 80/20 train/test split. Any tweaks in the model were largely ineffective, so I just stuck with the simplest one for now.
Next, I wanted to see how successful players were at using each type of shot over time. When you think of like 80s or so hockey, I always think of these big huge defensemen winding up slap shots and just beating the goalie from the point. But you rarely see the slapshot used as a weapon like that in the modern day. There are still a bunch of slap shots from the point, but they're now used to get pucks on net to let the forwards bang away at it and it always seems like a surprise when one goes in. Obviously slap shots aren't only taken from the point (see Ovi's office) but I wanted to see if there were any trends like that over tha past 15 years, where one shot type became a lot more or less effective. So I created different models for each set of 3 seasons from 07-19 throug 21-24 using the same parameters as above. I then kept track of the coeffecients for each shot type and looked at how they changed throughout the timeframe I was looking at. Looking back on this now, I feel like more of any potential change could simply be put up to how the league changes their shot tracking, which shots are classified as a wrist shot vs snap shot, tip-in vs deflection and so on. If a shot from just outside the goal crease was consistently being called a snap shot for the first 10 years, then changed to a wrist shot all of a sudden for the last 5, that would make wrist shots appear a lot more valuable all of a sudden. Player preferences of shot type could also play a factor in that change as well, and that is something I would be interesting to track, but with the inconsistencies in league tracking I wouldn't necessarily trust that.
The next thing I did was look at shot locations. The proportion of shots from each area, and how that changed over time. Neither of these metrics were super useful to building the xG model, but they could be used as an explination for certain trends. Plus they made 1 very pretty graph, and other quite interesting looking graph that I wanted to share and talk about.
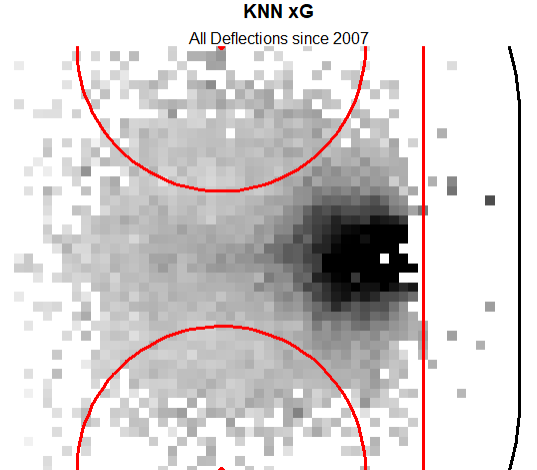
The next step I took was creating different models for each shot type instead of using the shot type as a factor in a larger model. Sure, slap shots may be less likely to go in than a wrist shot, all else being equal, on average. But a slap shot from 10 ft out probably has a LOT higher chance of going in than a wrist shot from 10 ft out, and probably lower chance of going in from the point. The effect of distance on the odds of a shot going in could change depending on the type of shot, so that is what I wanted to measure. For this, I split the data by shot type first, then split those smaller datasets into 80/20 trai/test splits, built the models then merged the testing datasets and compared results with the large model. I did get very similar testing results, but the complex model (seperate shot types) came out slightly on top, and I think the added complexity here was worth it and intuitively makes sense to me as to why it would be better, so that is the model I decided to go forwards with. I was also able to get more detail in my models, because I tested 4 seperate models for each shot type, one with distance squared, one with the season as a factor, one with both of those, and one with neither. I then chose the best one out of the 4 for each shot type. So each shot could have a slightly different model depending on which one came out best, but I think this makes sense by looking at deflections vs slap shots. Slap shots have a pretty flat chance of going in across the board, so for them it makes sense to have x and y be only linear. But for deflections they have a great chance of going in directly in front of the net, but a very very low chance of going in otherwise, so it makes sense for them to have distance squared in the model to really punish the shot for being a deflection from the top of the circles.
The next different thing I tried was a totally different (I think) method of building the xG model. Normally people do a logistic regression model and tweak it a bunch until it becomes as good as it can get. I wanted to try building a knn model. If you don't know what that is, it can give a similar output to logistic regression (odds of being a goal in this case), but it basically just compares each shot to a bunch of similar shots and looks at what percentage of them went in. In my case I compared each shot to the 100 most similar shots, and took the weighted average of those shots going in (1*similarity score if the shot went in, 0*similarity score if it didn't, then the sum of those divided by the sum of the similarity scores) as the probability for that shot. If you want a more in depth view of the differences between knn and logistic regression, I'm sure there are many better resources than myself online. One other difference is logistic regression is a LOT faster to train and test, so you can easily build multiple models and test them. For me for the knn model it took hours to test the data, and a day to run it on the full dataset. I literally just used the first knn model I could, k = 100 and weights and probabilities set to TRUE (Needed to set probabilities to TRUE because otherwise it would just return 1 or 0 for every shot, which wouldn't be helpful, and would basically just return a list of 0s). Then when that model outperformed the logistic regression model, I was quite pleasently surprised, but decided to move forwards with the knn model.
I did want to try one more "predictive" model, where the data I used to train the model was the previous 3 years of shots, then I tested it on the 4th year. So I trained the data on 07-10 data, and tested it on 10-11 data, because that is essentially what we would be doing (if we only trained on 3 years) when applying the model for next years shots as they occur, unless you're retraining a model every single night... Which I would hope nobody is doing. I ran the same models for each shot type for each set of three seasons, so I got "testing" data from 2010-11, 11-12, 12-13, and so on, all the way thorugh to 23-24. Then when comparing that data to the results of applying the other models on all of the data from those seasons, the year by year split performed slightly worse, so I didn't keep it for any of my future applications. However it was good to know that it was only slightly worse, and that the xG models I made are still largely applicable to the next season, even without retraining them. That was also only using 3 seasons worth of data, I could see how adding more data from further ago seasons could hurt or hinder the model as league trends shift.
Most of my work up to this point had been relatively new ideas, and measuring things that I'd never seen measured before, or I'd at least come up with most of my own methodology. These xG models were the first thing I made that we have an abundance of. I'd made xG, and NHLe models before, but never really wanted to share them, especially not outside of private discord servers and with certain individuals. Even though I used most of the same methodology as I did now, with a lot less understanding of how they worked of course, I never wanted to share them. I had massive imposter syndrome, that I'm just a high school student, or college underclassman, or have never had a job in industry, I'm not as smart as these people who are posting their models, so I shouldn't even share mine. Then I got to posting my new draft and development stuff, and it was received much better than I was expecting, and got a lot of compliments, so that encouraged me to move on and post stuff about this. And it made me realize that I do understand what I'm doing, and I'm smart enough to know when I made a good model, and when it's more of a flop. The actual analyics nerd community (I say that lovingly, as a proud member), the ones who make and build the models, and take time to write and read articles like this, are actually incredibly supportive of each other, and will complement you, or tell you if you fucked up sometimes, but in a respectful way. I don't know why I felt the need to put this paragraph in here, but I wanted to thank the people who I've talked to and had discussions with, and talk about some of my problems, that I'm not, and really nobody is, this elitest nerd that thinks all my models are the best (they aren't) and looks down on anyone who trys to make some model. I, and most of the community encourage people to make new models, try new things, there are infinite ways to build something as simple as an xG model, some far more effective than others, but still if you have a new idea and want to build it, don't be afraid to try it, share it, and get some feedback.
Speaking of different ideas to try with an xG model that may be incredibly stupid, I had one while writing parts of this article. I want to look at the odds of a goal happening within x amount of time from a shot. There is a skill, certain defenders had it when I played (not myself though) to always fire pucks on net to cause the most chaos possible. Even if the initial shot didn't go in, they got a lot of "+s" because they got the puck on net and it took a good bounce. Would this really be an important metric, "xgoals after 5 seconds", probably not, but its something that I would be interested in looking into at some point in the future. You could even extend this to other events like hits, or important faceoffs won or something. I know we already have O Zone and D zone faceoff splits, but if you can consistently win o zone faceoffs clean that leads to an extra goal or two a season or something, that would absolutely be notable. If every hit a player throws is perfectly timed to cause a turnover, could we measure that by this, vs if a player loves throwing hits but they're always late and the other team remains in possession of the puck. That could also be measured simpler by like "effective hits" or something, where we look at the number of hits you throw where the next shot attempt is by the hit throwers team, or the hit throwers opponent. I haven't made any of these yet, but they're on my list of future projects, though if someone else wants to look at them first, I would encourage that.
Results
Looking at how the coeffecients changed over time, I'm really not sure how much you can draw from this. I don't think tip ins got 1/3 as effective over the course of a few years. The NHL probably slightly changed how they measured the tip ins, and/or teams decided to start taking more of them with worse players. But regarless, here are the trends I saw:
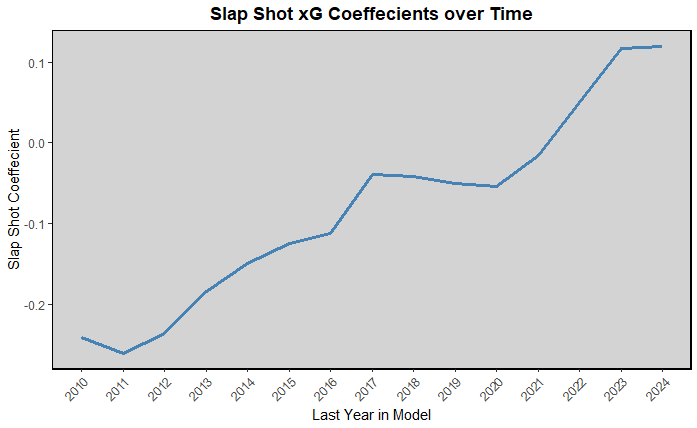
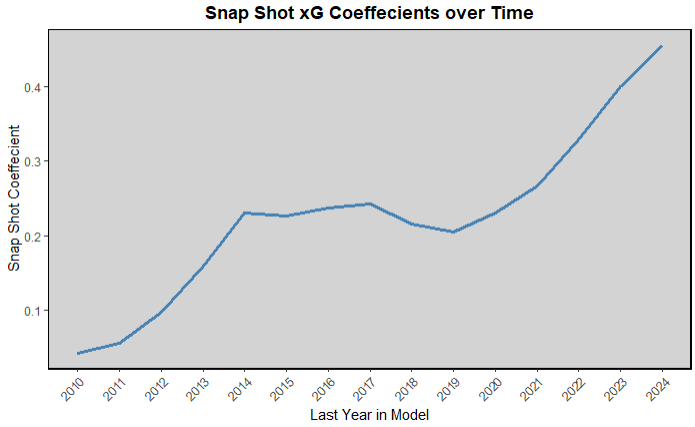
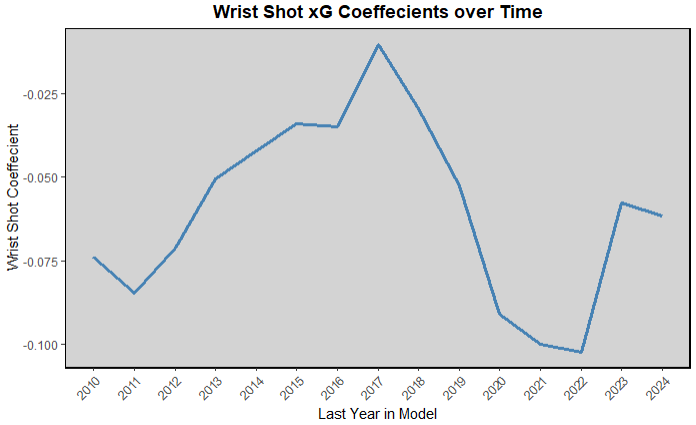
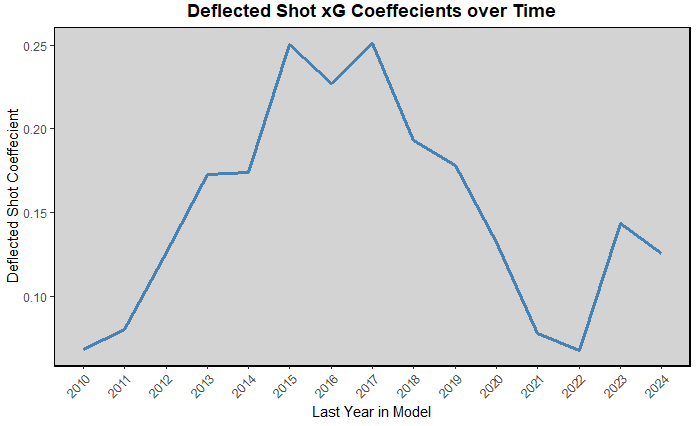
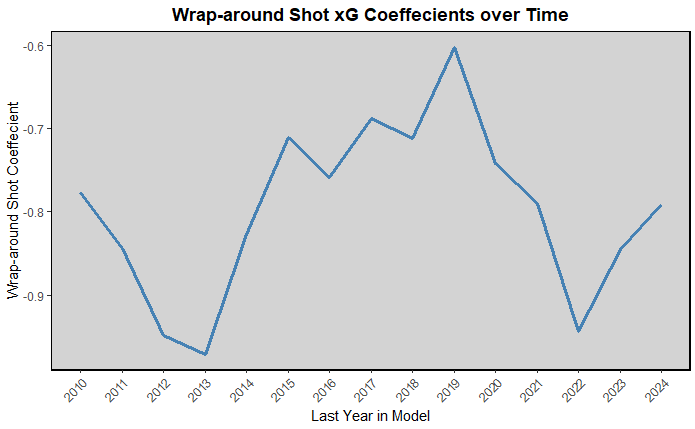
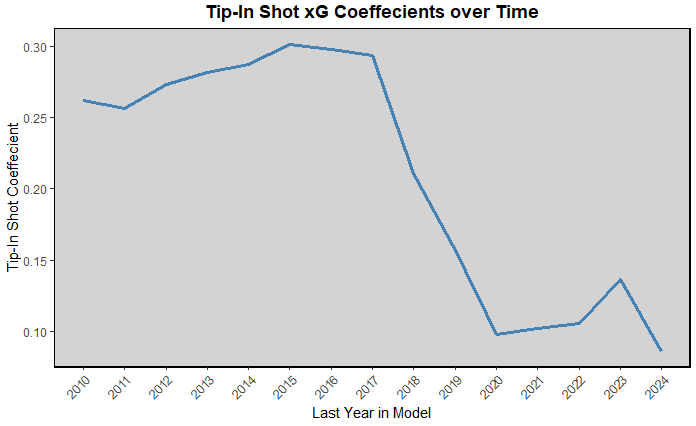
Looking at these by themselves instead of comparing them on a set scale makes the changes look a lot more pronounced. Wrap arounds and deflections both stayed pretty consistent from beginning to end, wrap arounds significantly worse than average shots from that location, deflections a bit higher than average. That makes sense because all wrap arounds are going to be from in tight, and they are usually a pretty low percent shot, but most other in tight shots are high percentage shots. Deflections, and tip ins both being even higher percentage of those in tight shots because the change of direction makes it harder on goalies than just a simple wrist or snap shot from the same location. Wrist shots, being the plurality of shots also barely changed, while slap shots did go from a negative coeffecient to positive, which is interesting and potentially important to notice. This also was just the coeffecient from the year model which did take into account other things, like location, which could change year over year and skew these graphs.
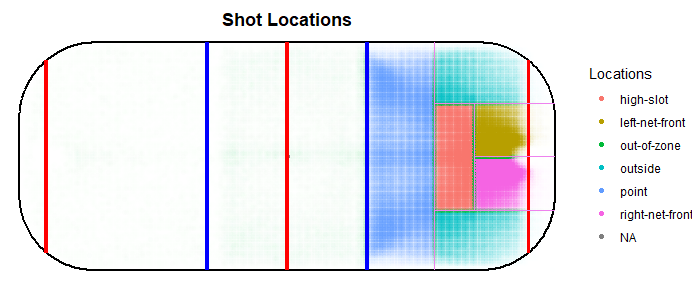
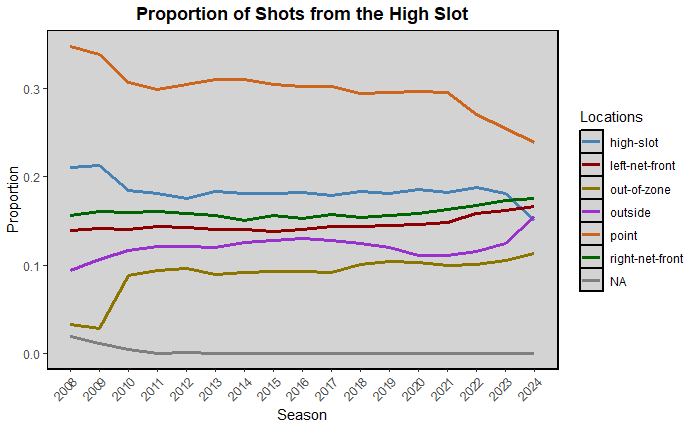
I also made these two graphs, which I don't think are particularly useful, but I just think the first one is pretty, and it lets you know what I determined to be each shot location. Then the second graph shows proportions of shots taken from each location and there were a few things intereesting from this graph. There was a lot of change between 2009 and 2010, and I don't think you would ever see as dramatic changes naturally just due to league systems, so I'm going to guess that the NHL was working out some growing pains with tracking shot locations and changed up the system slightly and this is the result. However, more recent trend changes, like point shots decreasing and shots from outside increasing intereset me and make sense with what I've been watching (Carolina aside). Also very interesting that left and right net front are very consistent across the board with right always being slightly higher than left. I woneder if that trend would continue if I just split the zone in two, or looked at left and right outside seperately.
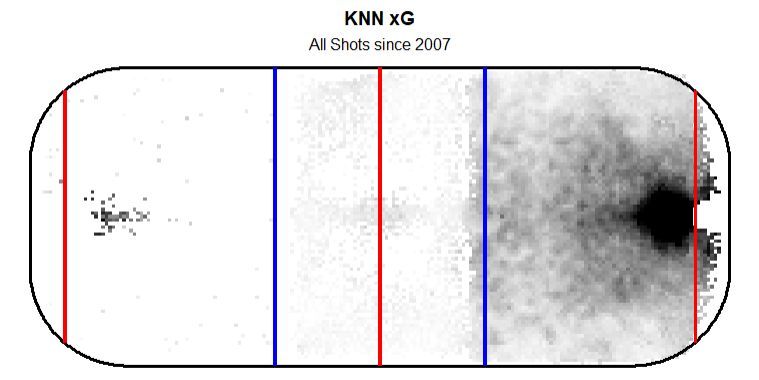
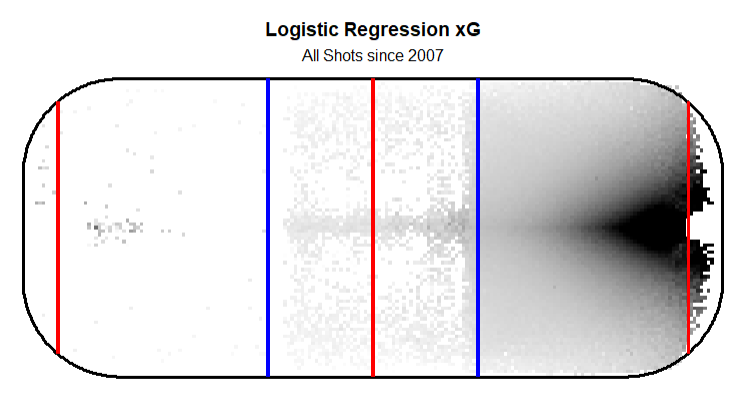
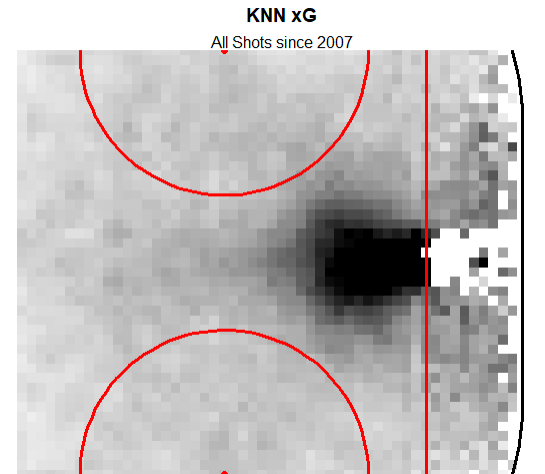
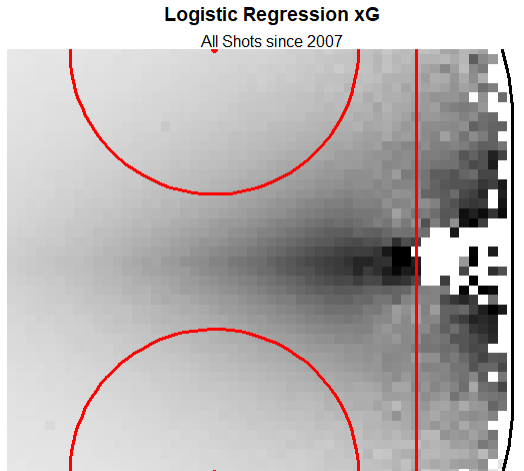
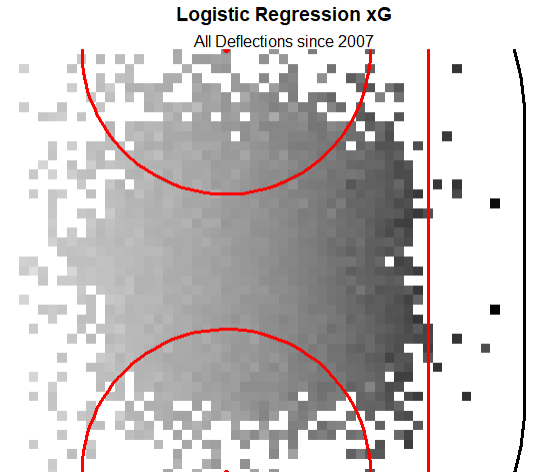
The next thing I wanted to look at was how the two models "looked" relative to each other and what one would expect. To do that I made "heatmaps" showing the xG value for each location where the darker the point, the more likely a shot from that location would go in. In the knn model you see a more spherical blob of very high likelihood shots with a small tail going away from the net. Meanwhile for the logistic regression model, it is obviously a lot smoother, but more triangular with a light fade. There are a few "high percent" shots in the defensive zone, that are either empty netters because most shots from back there are empty netters, or own goals, and I'm not sure how the NHL tracked those. Also, knowing how KNN and logistic regression are calculated, it makes sense that the plots are shaped the way they are. With the KNN model, shots are closer location wise in a 360 degree "bubble" vs in logistic regression, it doesn't look at other shots, and smooths out the results under the assumption that 1 inch further out to the x or y direction is less likely to go in.
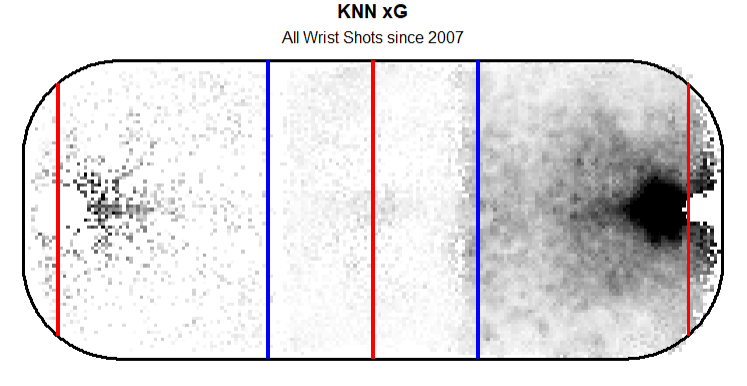
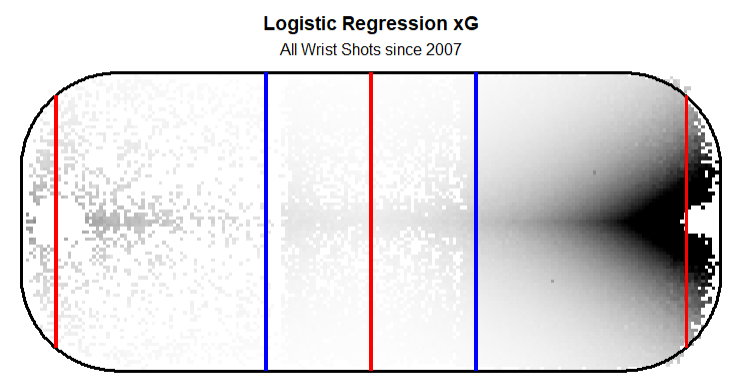
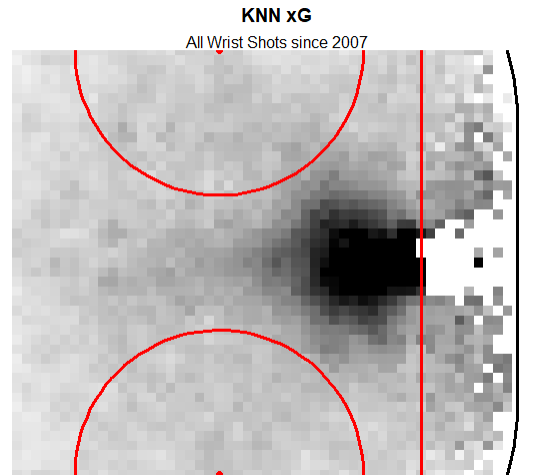
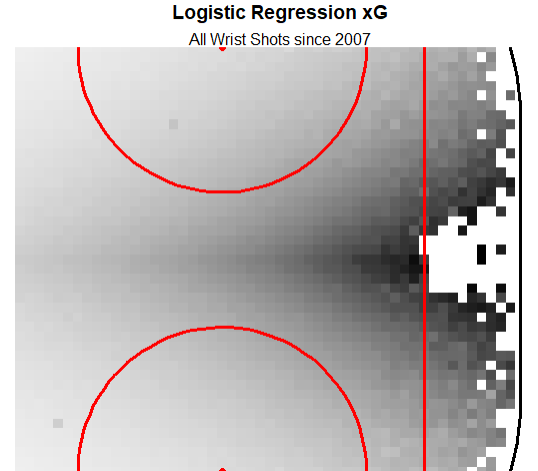
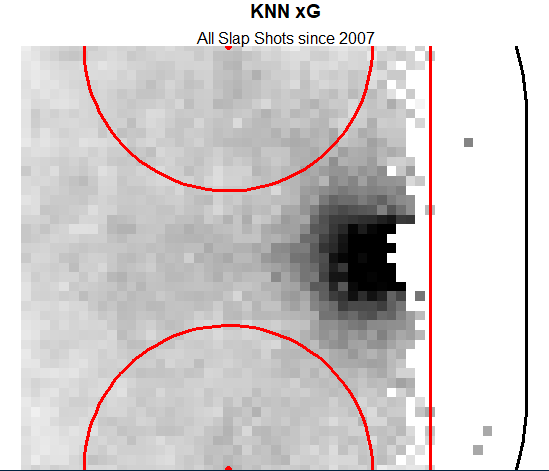
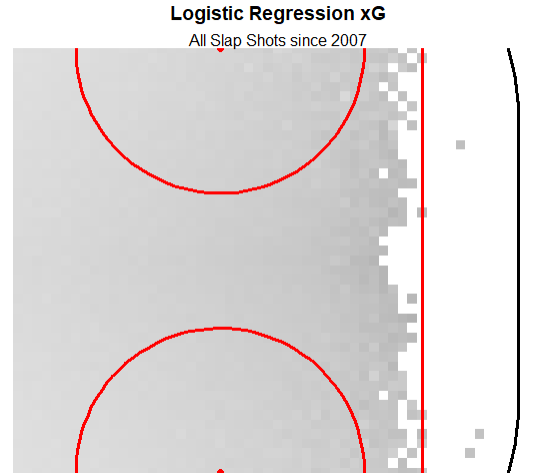
I then split the same plots by each shot, just looking at which shots were most effective from which locations. I kept the same scale on the alpha, so the percentages are "marked" the same where the same shade of grey corresponds with the same percentage across all of the plots. Wrist shots were probably the most interesting to me because of how similar they were to the overall trends. Wrist shots were the most common shot type, but they weren't a majority, so they shouldn't have THAT big of an impact on the heat maps. However, wrist shots are still the "generic" shot type, so they are going to follow similar trends. If there was a point on the ice where write shots were much better than average, teams would take a lot of wrist shots from that spot. However, because wrist shots are relatively evenly spread out (relative to other shot types) it makes sense that the heat map for wrist shots relatively tracks the heatmap for the overall shot trends.
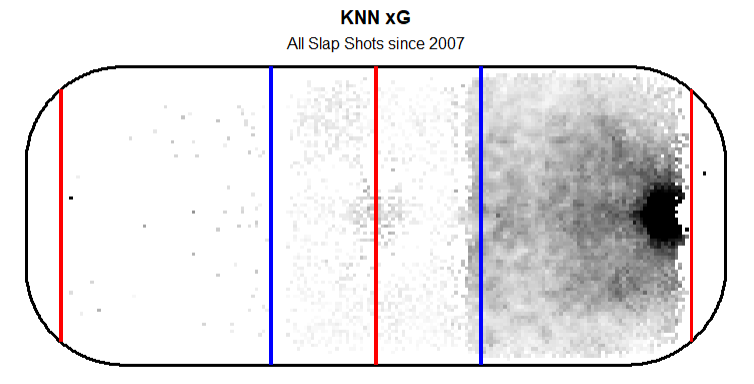
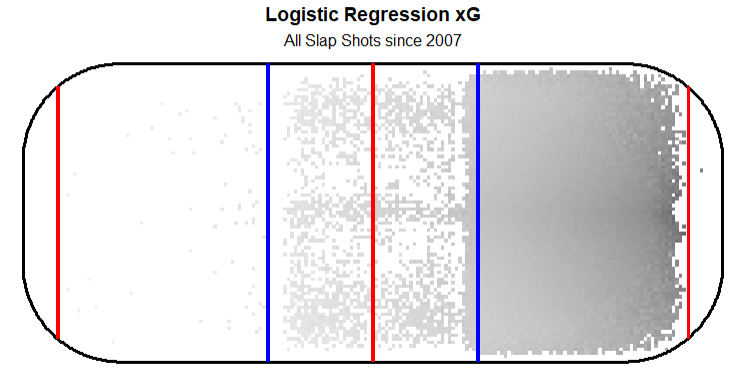
Then looking at slap shots, you see an interesting, but not unexpected trend. The two models look like vastly different results, but in reality they are pretty similar. That big dark blob in fron of the net in the knn model probably makes up less than 5% of the slap shots. Such a low percentage that the logistic regression model doesn't even pick up on them and just makes it basically a flat rate all the way out, which you also see in the knn model outside of that blob that is very few shots. KNN does appear to give slap shots slightly higher percentages than the logistic regression model as well, but again not by a ton, and the logistic regression model just smooths everything out.
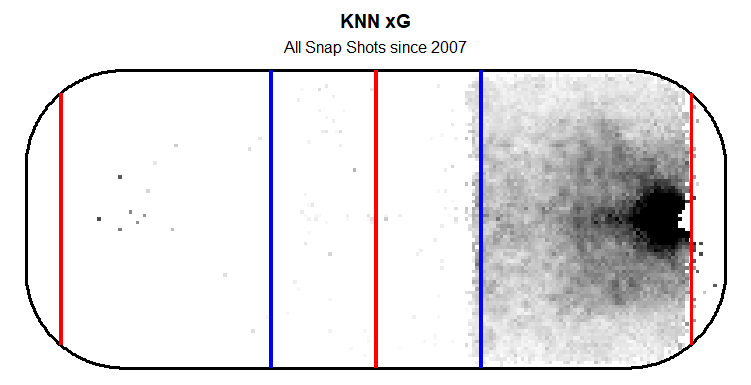
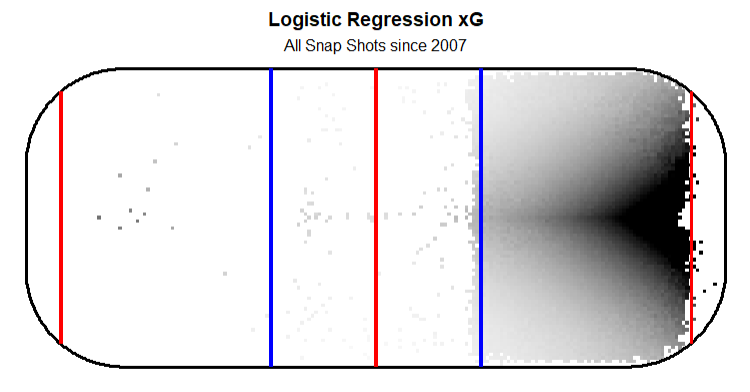
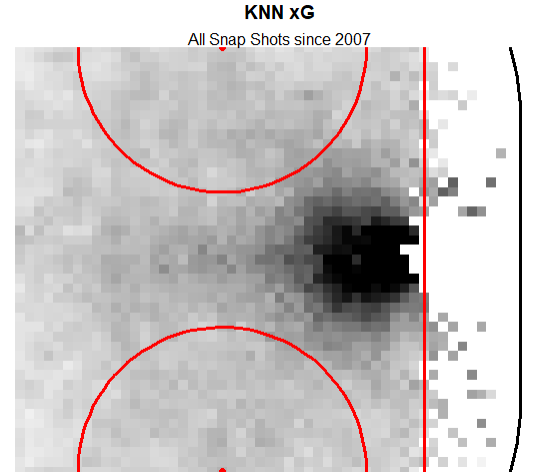
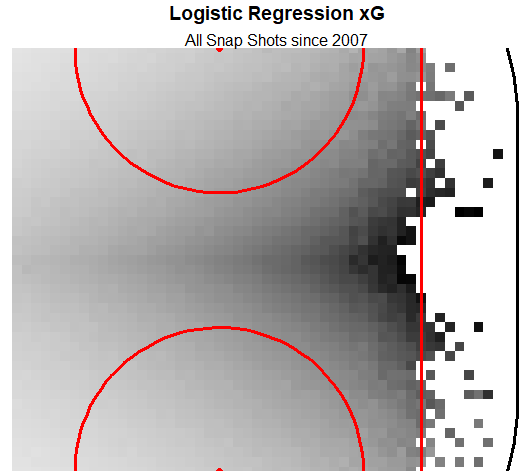
Snap shots are another relatively generic shot type that players take from anywhere anytime they need a quick release and can't get a full windup in. Again you see trends pretty close to the overall trend with snap shots. A round blob for the KNN model, and a triangular/parametric(?) smooth curve in the logistic regression model. They may be a bit closer in to the net than overall, but I my eyes may be deceiving me.
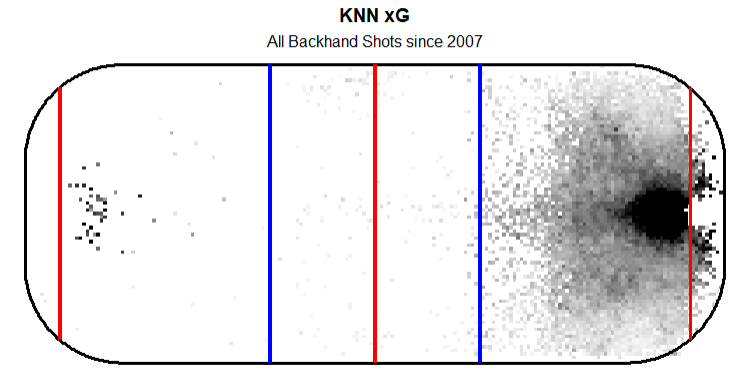
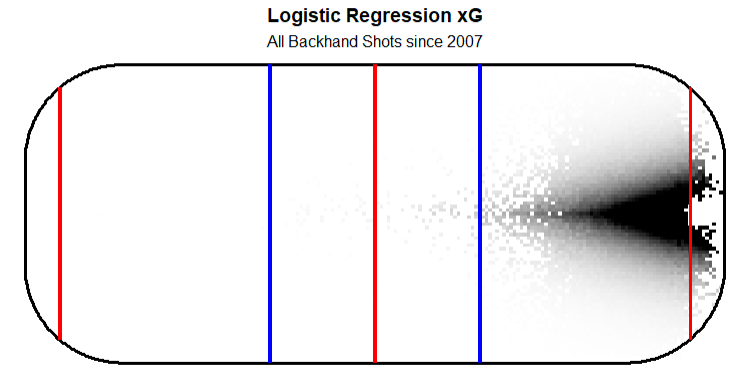
Moving on to backhands, yes, I did in fact forget that they existed until now when I was initially doing my analysis earlier, and I never felt like going back to look at the coeffecient and whatnot. Undurprisingly, you see a very tight blob around the front of the net, and I think a little wider base of the triangle for the logistic regression model. That would make sense for me because it is incredibly hard to score on a backhand from outside the net front or side. Even elite talents can't get enough power on a backhand to consistently beat goalies, so they would all prefer to shoot a wrist shot from outside. The one benefit from the backhand is I feel like it is more effective at sharp angles, and it seems to have a higher xG than most slightly out wide.
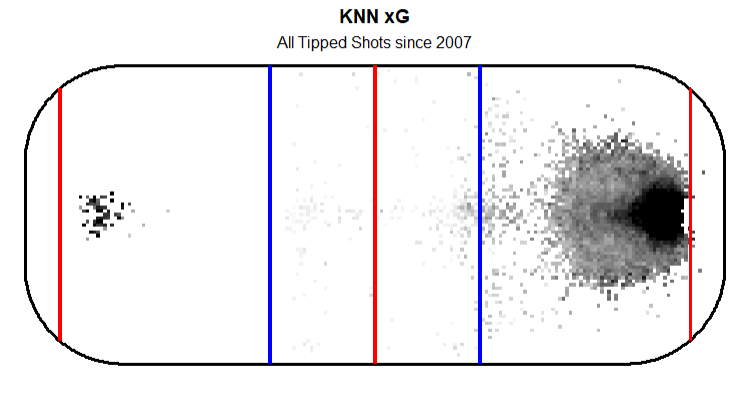
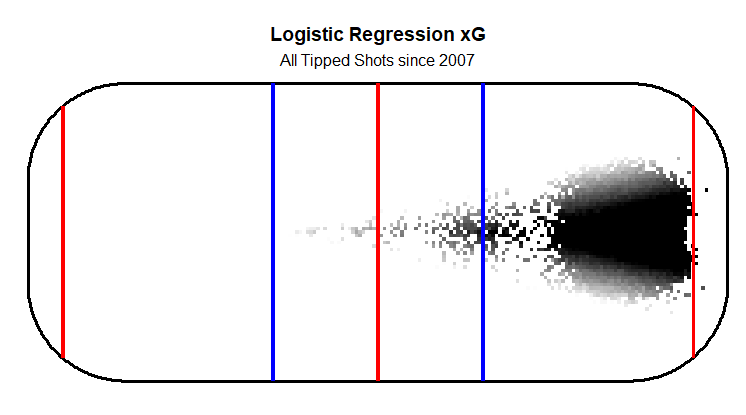
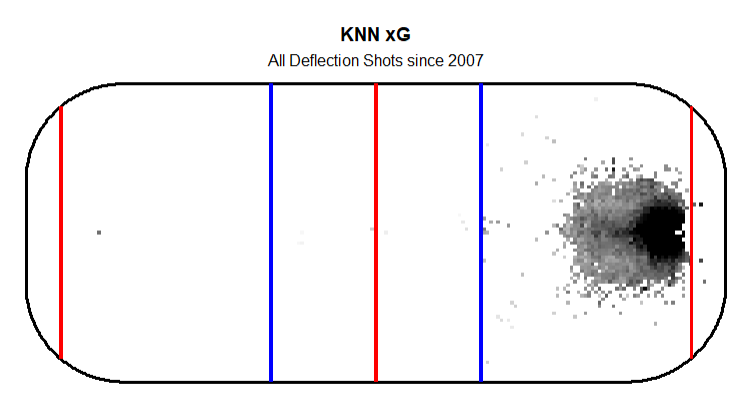
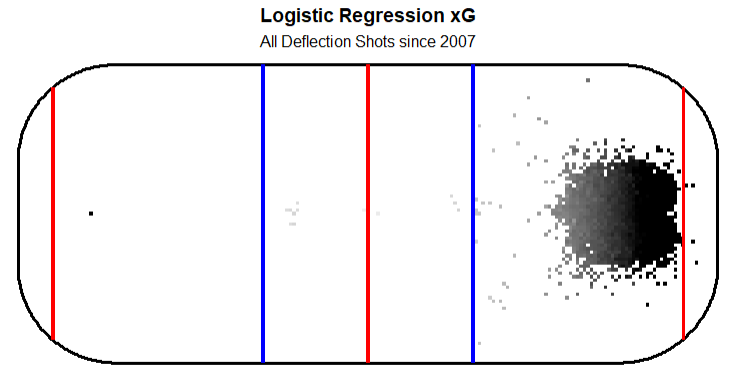
Next, I wanted to look at tips and deflections together, and from this zoom level, I don't think we can tell much. I think that there are so few tipped shots, that when making the seperate model for just them it gave a very high baseline coeffecient snd didn't have to punish much for distance because there were so few from the outside that the logistic regression model errantly gives tips from outside the blueline a good chance. Other than that, all of the other three look very similar, very high percent shots from right in front, but very low percentage otherwise, and almost none even occuring from outside the faceoff dots or above the circles. Which that all makes sense, while I'm not really sure how the NHL defines the difference between tips and deflections they're both certainly shot types that involve changing the direction of an already moving puck in one motion, which that is going to be incredibly effective in tight, when the goalie can't react, but less effective from anywhere else when it slows the puck down and gives the goalie more time to see it.
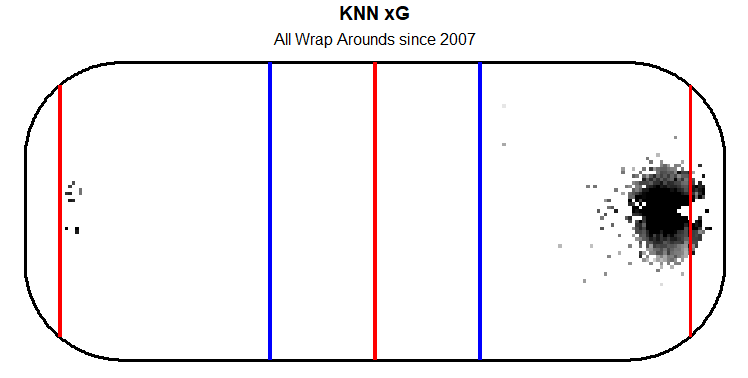
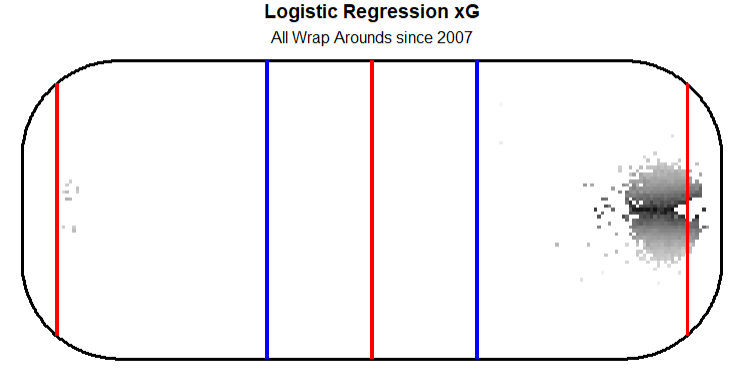
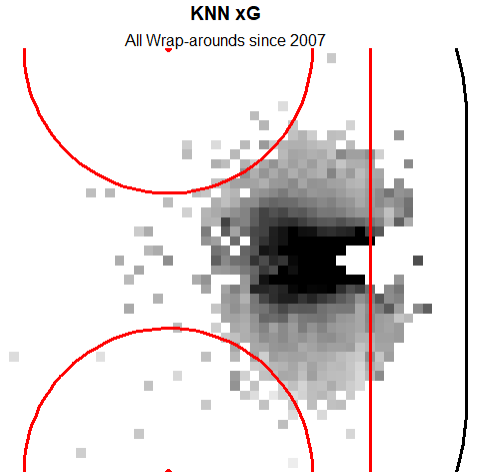
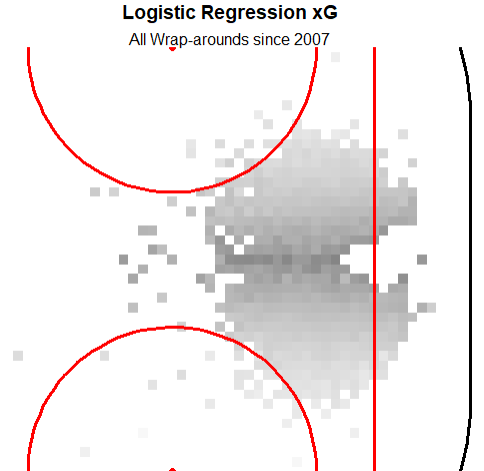
The final shot type I wanted to look at was wrap arounds, which, as you would expect are very much a net front ONLY type of shot. KNN gives them a decently high chance of going in unless the player takes it wide, but thats probably more because those shots are similar enough to deflections or wrist shots from the same exact location than a wrap around from the other side of the net or something. Then the logistic regression model just gives them a slim chance of going in unless they're taken from directly in front, which doesn't make sense, I would assume it should be directly in front of either post, you want to make it quick and tight around the net instead of coming back around to the middle, but you can't really get that shape with a logistic regression model only looking at distance and distance squared.
I also wanted to look at how each shot type looked just in between the circles. Because the way I did the alpha multiplication for the zoomed out charts, every shot within a certain point looked like an equally valuable shot, which obviously isn't the case. So here are all of the same charts as above, just zoomed in to inside the circles and with a lower alpha to not just make all of the values 1. Logistic regression you see still loves shots in front of the net, almost in the crease, then the few shots taken behind the net it also loves because that is where the coordinates are closest to 0 I think, which is my mistake, I should have zeroed on the goal line. Then for KNN you also see a similar trend of there being a blob, but this one is more rectangular, but that is probably more due to the "pixelization" of the image.
Then for wrist shots, you again see a similar trend to the zoomed out version, and the overall zoomed in version. Wrist shots are still the "generic" shot type, and I feel like most of these zoomed in charts, are just going to be like fractals repeating in on themselves if we could zoom in infinitely.
The logistic regression slap shot chart might be the funniest one here, it is entirely useless because there are so few slap shots taken from this area, but the model basically j ust shrugs and says "why would you/how could you even take a slap shot from anywhere in here". Then for KNN you do see that blob directly in front of the net, but again, there are so few slap shots from that area that it is probably comparing slap shots to deflections and tips from that area instead of slap shots from outside. All of which of those shots have a high likelihood of going in though, I'm sure, and this is where I like the granularity of the KNN model more than the smoothness of the logistic regression one.
Snap shots are pretty similar to each other here, definately more distinct than wrist shots were as well. There is a big dark blob in front for the knn model, as always, but the logistic regression model doesn't love snap shots as much, but, similar to slap shots, and more similar to the wide blob in the KNN model, it also doesn't punish them as much for being taken from out wide like it usually does. This was probably the modt interesting result to me, I expected snap shots to follow the same general patterns, and have a lot of decently dark blocks in front, but it didn't have either.
Then I only looked at deflections here because there were more of them I think, and they were very similar to tips again. You see what you would expect to see here, a big block in front in the KNN model, and I like the line stretching wide of the net in the logistic regression model. I like that line because a lot of deflections come from redircting shots that were headed wide towards the net that you don't see as much with other shot types.
The final shot type I wanted to look at was wrap arounds which gave me the other funniest chart. There aren't a ton of them, but man does the logistic regression model REALLY HATE wrap arounds. Like it makes sense, they are very low percentage shots from where they are taken, and players only do them in very specific situations, but it's still funny to me. Again the KNN model is slightly more favorable to them, but still not good, and still I'm assiming atrributing most of the sucess from those in the middle to non wrap arounds taken from the same location instead of other wrap arounds.
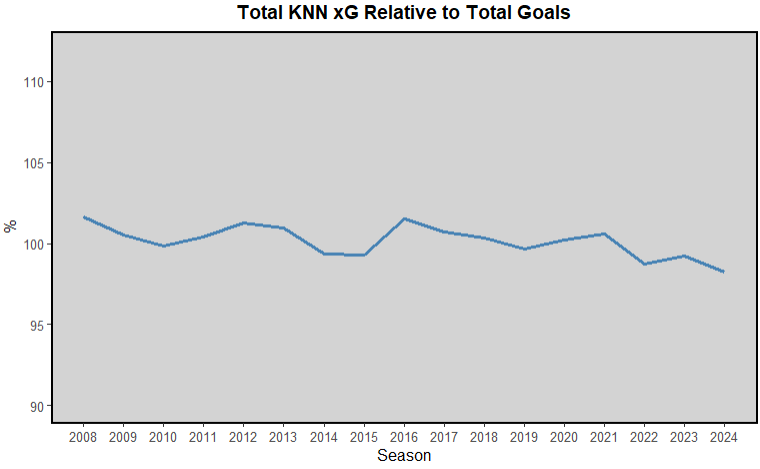
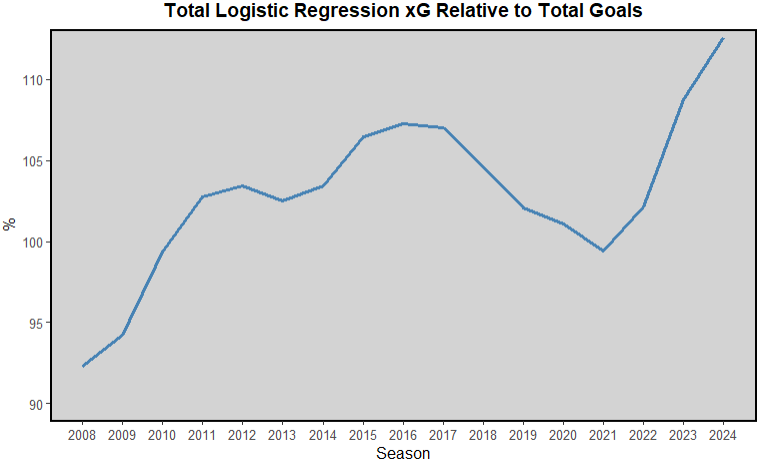
The last thing I wanted to do to judge my xG model was look at how well it correlated to the total number of goals in a season. Ideally the total number of xG is exactly the same as the number of goals. Obviously that is not realistic, but you want to keep it within a reasonable amount. I ran the KNN one first and was quite impressed that it always stayed within a percent or two of total goal. Obviously I used 80% of the data to train, then for this test I "tested" on just all of the data, not just the 20% testing, so it was bound to be close, but I was still pleasently surprised. (I had long since merged the data sets as this was almost the last thing I did, so I didn't have my training or testing data anymore). Then I ran the same thing for the logistic regression model, and got shockingly poor results, especially considering it had the same train/test split conditions. This is mainly what caused me to focus on the KNN model as the main xG model moving forward, though I still used both of them at times, just to give a small comparison.
Data
I did get most of my shot data from evolving hockey's querey feature. I hae tried to run scrapers to get data directly from the NHL api, but it's always been a mess every time I've tried to build that scraper in particular. I've built many others succesfully, but just never one for the NHL API. So the EH queries are the next best thing, and they come mostly pre-cleaned. Though they were behind a paywall, I feel like I've done enough data manipulation that I can share this, especially in a portfolio style website that I don't plan on being profitable from.