Overview
To start my NHL modelling, I wanted to make a relatively simple xG model. To do that, I first needed to get the location and outcome (miss, shot/save, or goal) of every single shot taken since 07. With those shot locations, I started looking at where most shots were taken from (inside), who missed the net the most, who scored more from certain areas just out of curiosity. Then I realized I could make a shotmap of where a player shoots the puck the most.
This was a very simple process, with very little in the way of statistical modelling. I just wanted to make a cool data viz, and I think I was somewhat successful. All I did was create a diagram of a rink then put shot locations on it. I just filtered the big dataframe with all of the shots on it to one particular player then used that one. Then I realized you could do something similar with game state (5v5, 4v4, etc) and seasons, so I added those filters. Then I combined all three into one plot and created the app that allows you to select certain filters/a player. Then I added goals being purple stars, for no good reason other than I wanted them to stand out for fun plots like Ovi's where all of the PP goals come from one spot. The one notable thing I did was flip all shots to be taken with the top left being the O-zone left circle side, and the right side being shots taken from the d zone. Then I had to flip NZ shots by checking the home team and period, so I'm not sure I did that correctly. I also removed all shootout shots, and shots where there was a scorekeeping error (game state Err, 4v0, 5v1, or something like that).
Results
In terms of results, there really isn't much to share, I love Ovi's heatmap that truly does show his office
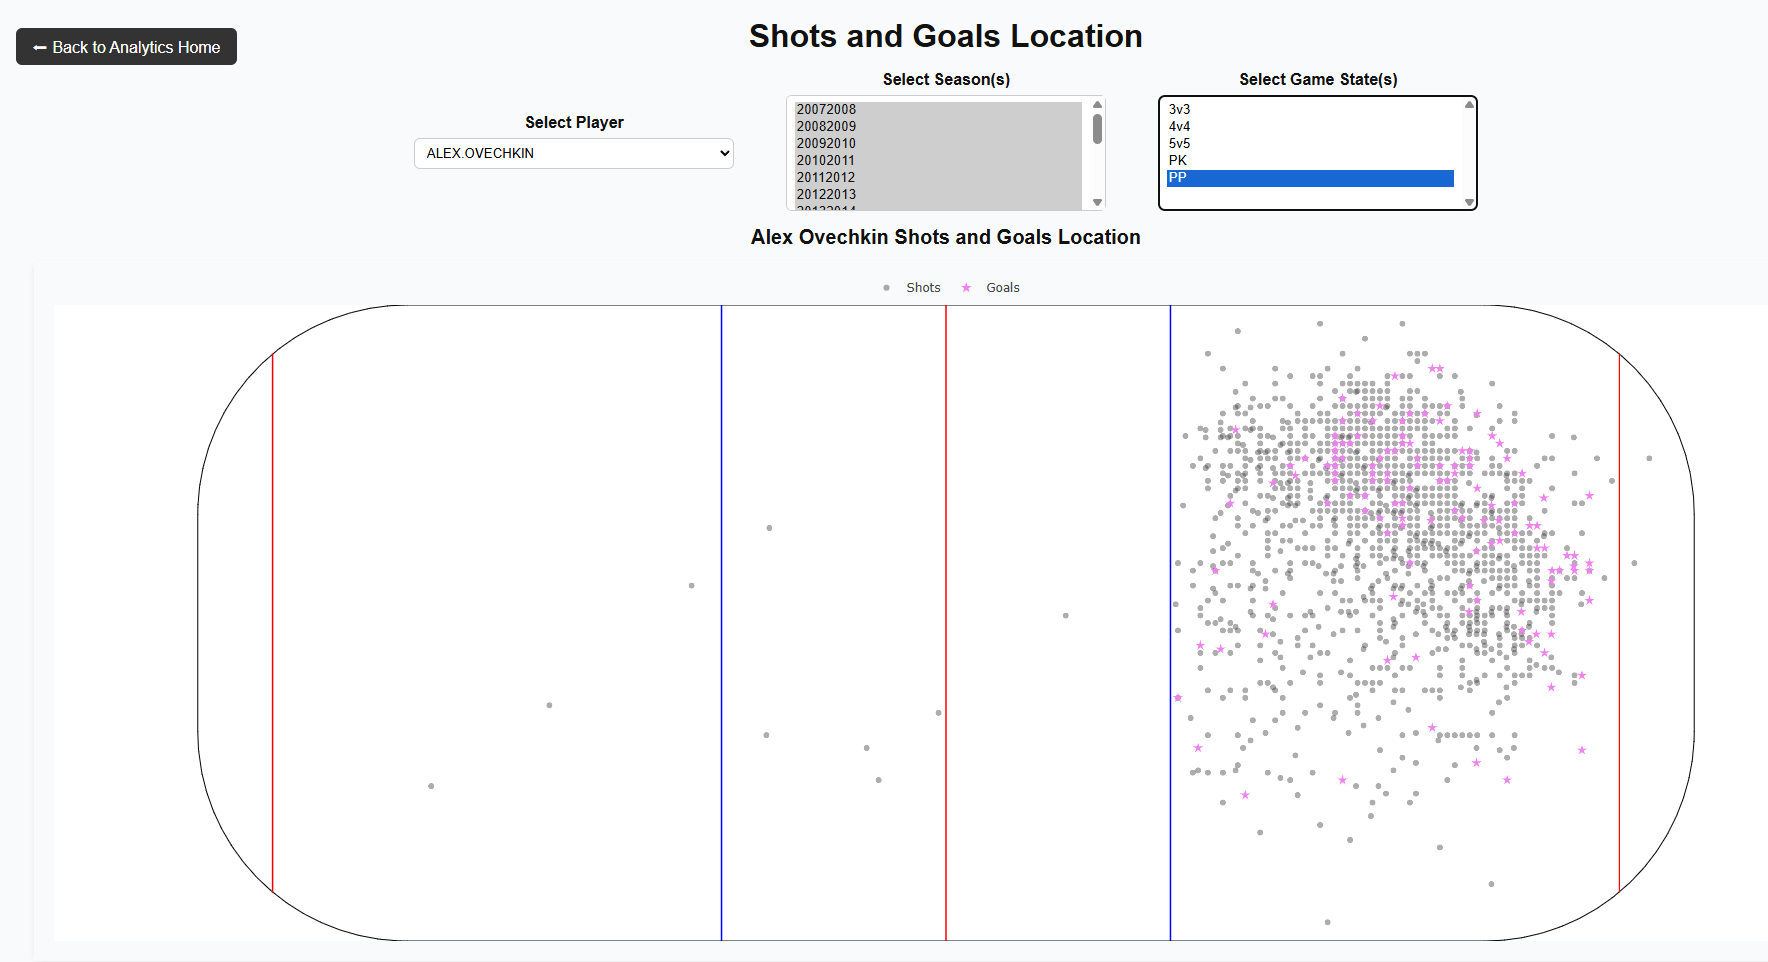
Like even other pute shooters on the PP like a Steven Stamkos just don't come close to his prolific-ness or his sheer consistency of ONLY shooting from one spot.
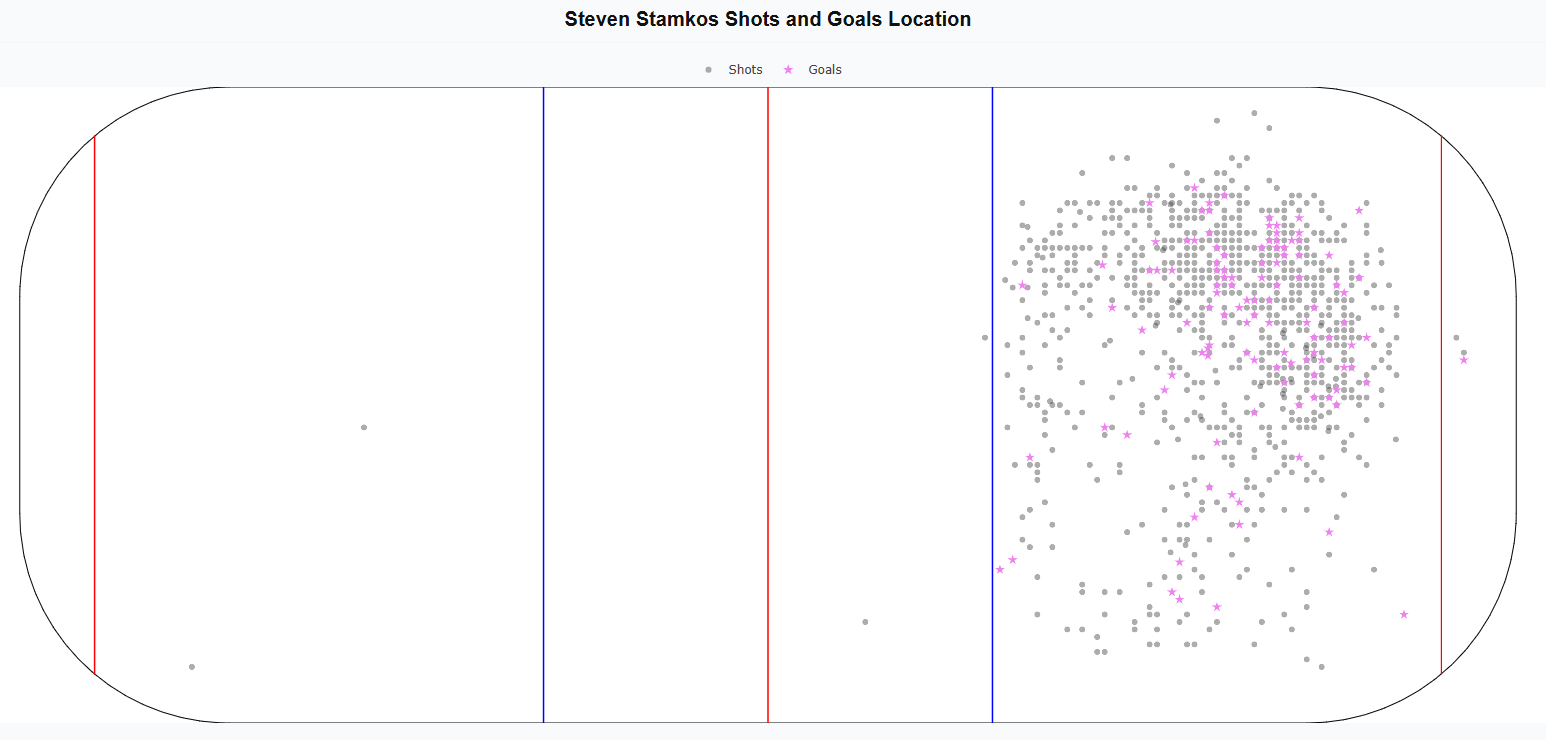
Like at least with Stamkos you have some shots from the right wing side and down the middle, and a bunch of shots scattered throughout. Another fun one is Zach Hyman's 23-24 season. I remember seeing a stat that was like his first 40 goals were scored like an average of 3 feet away from the net or something insane like that, and welp... checks out...
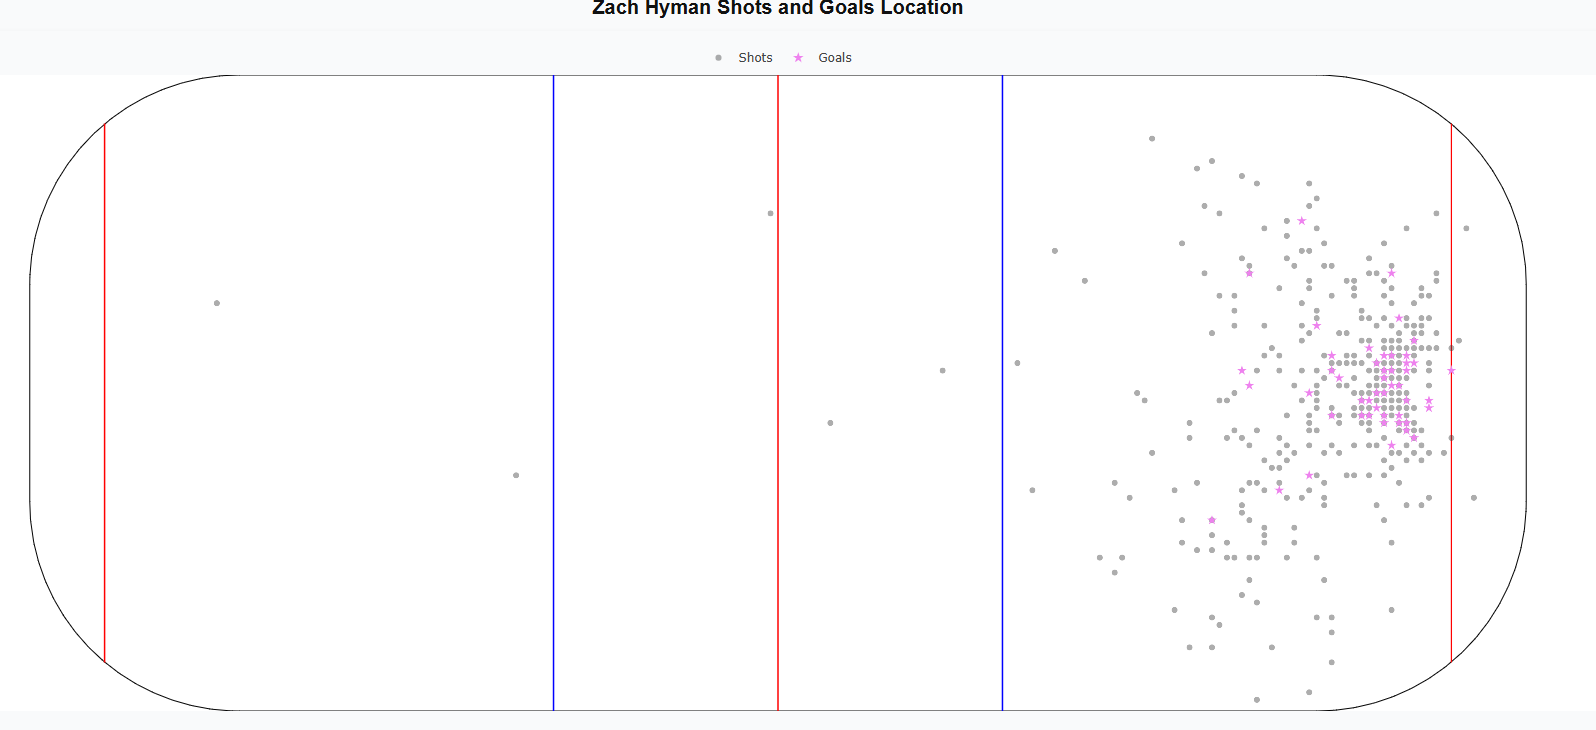
On a similar note to Hyman, is Patric Hornqvist's career chart. My mid 2010s pens goat, what an absolute legend, one of my favorite players of all time, he knew his role and played it almost perfectly, and I don't think the pens win both of those cups without him.
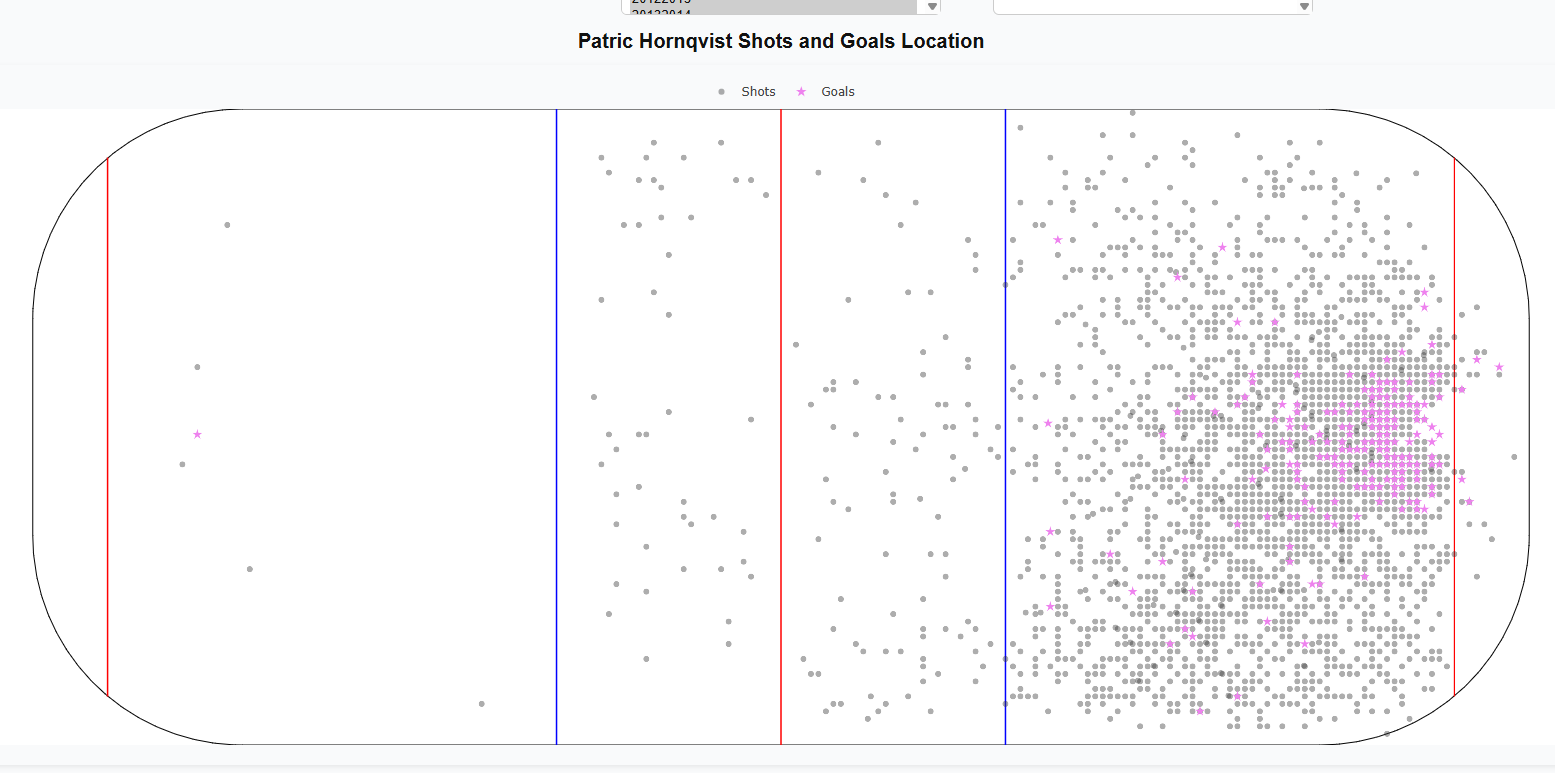
More importantly, I did make this into an interactive app that anyone can go and look at certain players or seasons. Go to the Player Shot Maps tab in the page listing all the articles, or simply click this link here
Data
I did get most of my shot data from evolving hockey's querey feature. I hae tried to run scrapers to get data directly from the NHL api, but it's always been a mess every time I've tried to build that scraper in particular. I've built many others succesfully, but just never one for the NHL API. So the EH queries are the next best thing, and they come mostly pre-cleaned. Though they were behind a paywall, I feel like I've done enough data manipulation that I can share this, especially in a portfolio style website that I don't plan on being profitable from.