Overview
One other trend that I wanted to look at was how the location of shots changed over time. I don't remember how I stumbled onto this idea, but I remember making the overall one because I thought that would be interesting, then I probably though something along the lines of "well, CAR shoots nothing like that the past ~5 years, so I wonder if other teams can cahnge the league trend".
To make the graphs it was pretty simple, I started by rounding every shot to the nearest foot. Then I grouped by shot types, mirrored just the offensive zone ones to always be on the positive side (and mirrored the y axis for those shots as well). I only mirrored the offensive zone shots, and removed all of the defensive zone shots because there are so few of them they would nver be visable on the end graph. I then plotted each location with a square point the exact right size to fill the 1x1 grid, then set the alpha to be a multiple of the number of shots from that location. The multiple was obviously a tiny value that I played around with before settling on [I can't find my code for this project and have no clue what the value was, but I think it worked well bc the graphs look good!].
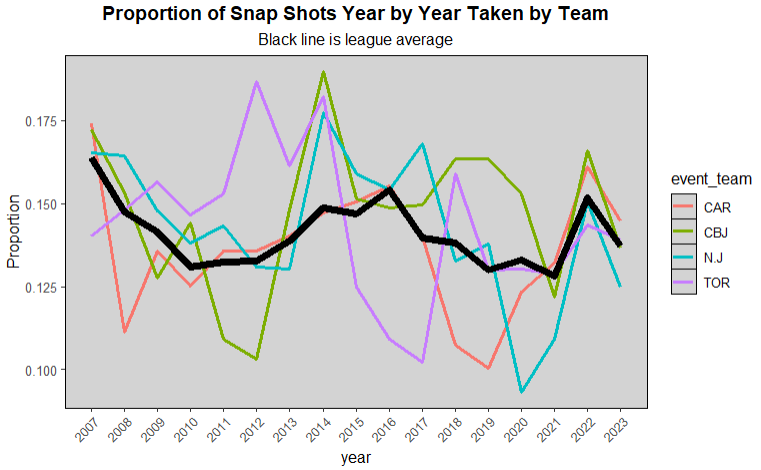
Then, on a sort of similar note that I thought of while looking at the xG values for snap shots, I thought I wonder how scorers choose to give out snap shots vs slap shots or wrist shots. So I wanted to look if that was something they are consistent at or not. I checked this by comparing certain teams snap shot proportions in their home games to in their away games. No this isn't a perfect comparison because if the team genuinely shot more snap shots than average, then of course it would appear as if their scorekeeper gave them more snap shots. Unfortunately it was not just a bit off like you would expect from that. Unless teams are shooting 5x the amount of snap shots as other teams for just one season, I think there was something funky with either my data cleaning, or the NHL scorekeeping. And knowing what we know about shot location variances, and hits/takeaways, I would tend to lean towards the NHL having inconsitent scorekeepers. I only looked at snap shots, because it was the "fuzziest" shot type I feel like. A lot of them could be classified as either wrist shots or slap shots depending on what the shot looked like and how the scorekeeper was feeling that day. It would be potentially interesting to look more into next year, and could maybe be another factor if/when I decide to rework my xG model.
Results
The overall shot map was interesting to look at but not too insightful:
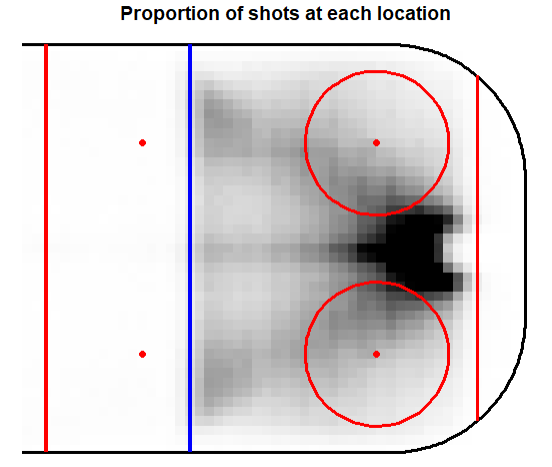
Obviously teams try to funel their attack towards the net, so there will always be a giant black blob in front of the net. It is a small area and there are a lot of shots that come from it. Then obviously there are a lot of shots from the point where the d stand. But the interesting thing about that is the somewhat distinct "trails" connecting the points to the center of the ice. This could be d men stepping up, or players shooting on the rush, but I feel like most rush shots are from further outside, but I suppose not. Then another interesting thing is the blob/line in the direct center of the rink. Obviously we like shooting head on with the goalie, but I'm not sure why that's there. Nobody really ever stands in that spot except on the PP maybe? Teams love running 1 man high on the PP, but I feel like that guy usually isn't the main shooter, there's usually a dedicated triggerman elsewhere, or they'll try to work it low through a bumper man, but maybe there are enough PP point shots for that line to exist.
Now looking at all of the year by year graphs that I conveniently turned into a gif I noticed some interesting trends. First the big blob in the middle doesn't really change much. Maybe a few border pixels each year, but I can't really tell if there's anything more because I ddin't snip the maps identically so when I made the gif they do shift each year. But what really interested me was the trends in the point/outside shots. It started off with there being a lot of outside shots, but clearly more in the expected shotting lanes. Then it got a little bit fuzzy where there were still a good amount of point shots, but from all sorts of shooting lanes. Then the proportion of point shots significantly decreased, but you could see the clear shotting lanes again between the late 10s and early 20s. Then these past few years, even those common shooting lanes seem to have dried up. There were very few point shots in 22-23, and almost none seemingly in 23-24 (relative to previos years at least). There also seemed to be a shifting of the point shots to the upper circels area, outside the high slot, but inside the point, where you can get somewhat close to the goalie and shoot from a different angle. I couldn't tell you why that's happening, but I feel like I've noticed fewer point shots too recently, aside from Carolina of course, so this data kind of backs up my thoughts.
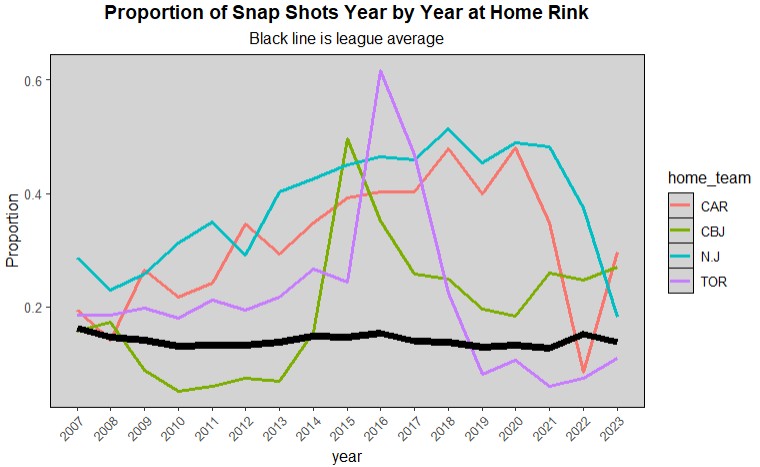
This may have been the most interesting result to me, partially because I didn't beat it into the ground by looking at every other shot type, but also because of how unexpected this was. Just look at 2016 Toronto, pretty respectable team, pushed a great Caps team in rd 1, and showed the beginning of what they would be for the next ~decade. But I don't think that SIXTY PERCENT... 60, SIX ZERO PERCENT, of that teams shots at home (both teams) were snap shots. League average was a hair over 15%, Toronto was about FOUR TIMES THAT. Then on the road they were below average, so I don't think it was a system thing. Maybe I messed up cleaning somewer, but I would lean towards the NHL having inconsistent scorekeepers. The rest of these teams were also cherry picked because they were consistently well above to 2+x league average. If it was just one team I wouldn't be shocked, but multiple teams having gone through multiple coaches and GMs each always staying that high, I doubt it. This could also mean a decent bit when it comes to xG modelling. If a team gets credited with 2x the amount of snap shots as another team, when they should all be slap shots, their xG will almost certainly be higher than the slap shot team. That would not be determined by the guys on the ice, but a random dude in a press box somewhere. I don't really know how one fixes this issue, because you have to classify the shots as something, what do I do, just randomly assign 66& of 2016 Toronto's snap shots as another shot type? That isn't fair either, so I think this is just an area where we'll have to live with the NHL's inconsistency. This also probably won't be changing anytime soon even if they release more of the NHL edge data, I don't think that can really track shot types yet.
Data
I did get most of my shot data from evolving hockey's querey feature. I hae tried to run scrapers to get data directly from the NHL api, but it's always been a mess every time I've tried to build that scraper in particular. I've built many others succesfully, but just never one for the NHL API. So the EH queries are the next best thing, and they come mostly pre-cleaned. Though they were behind a paywall, I feel like I've done enough data manipulation that I can share this, especially in a portfolio style website that I don't plan on being profitable from.