Overview
The other "stat" I thought of while working on the RAPM model came about in a similar manner to the relative to league one. I wanted to look at a different way to contextualize players' stats using their linemates and whatnot. So for this one I looked at every set of 4 players they played with (again filtering to 5v5 only) and looked at how those 4 players did together, without the player I'm looking at as the 5th player. I then took the weighted average of all of those groupings, with the weight being the amount of toi they spent with the 5th player. Then I used that as the "expected value" for the player, which I subtracted from that player's stat to get their rel line stat.
I did this quite simply by looking at every single grouping of 4 players, and every single grouping of 5 players. Then I compared the two lists, making sure that each group of 4 had multiple different "5th players" so I can actually compare them. Then I filtered the big df (full line combos) for each player to only include lines that had that player, then I filtered that player out of the small df (4 name combos) and inner joined the two so I was looking at stats with that player on one side, and with the same four guys, but without that player on the other. Then I took the weighted average of both, weighted for TOI and subtracted the difference. There was no fancy modelling, KNN, or ridge regressions, just simple line comparisons and subtraction.
The main issue with this would be the sample sizes. Most players only play with a full other set of 4 players for a few seconds, without a change, or something to make it not 5v5 anymore. Then how much did those oter 4 players play without the initial player, often not a ton as well. Obviously those lines that barely played together or apart didn't matter, but this starts to run into a similar issue as RAPM where if a player plays SO much with his line, and they play SO little without him, one or two shots in the time without could totally skew a players stat unfairly. Or inversly, and more commonly, if a player joins a group as the 5th man that already plays together a ton, and are pretty successful, then they aren't as successful with the player in the short time they do play with him, that could drop the players ranking as well.
Results
The first thing I wanted to do to check my results was look at the top players in a few stats from the previous season. I got some mixed results, some players I expected to be at the top, especially in the offensive metrics, then the defensive metrics were poor, so I didn't even post any of them on twitter. Then browsing some of the defensive results in the app I did not like them, but offensively, may be the best lists I've made:
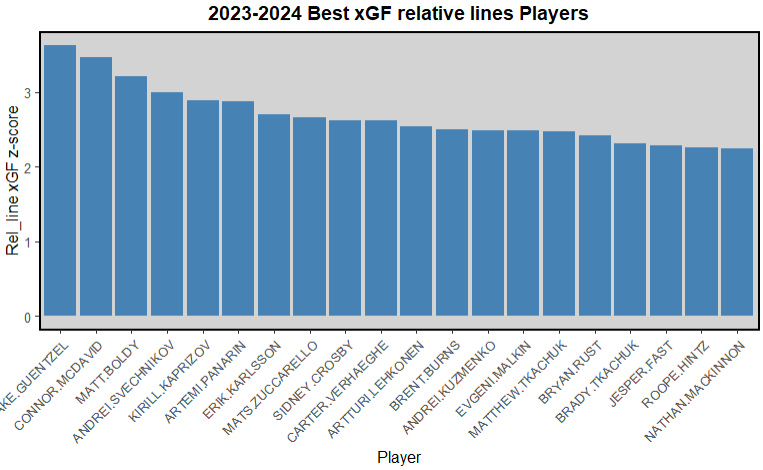
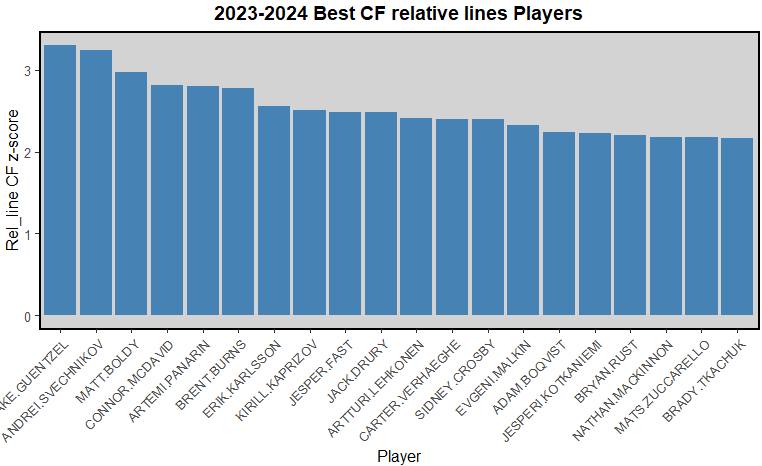
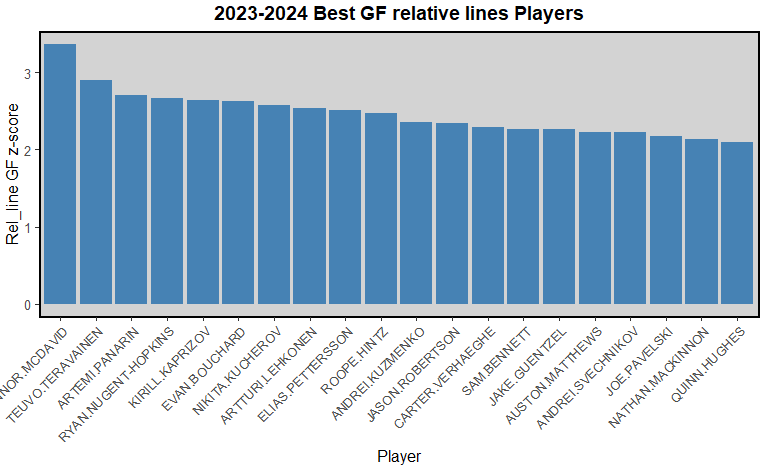
I love seeing all of Guentzel, Rust, Crosby, and Geno on here, really shows how poor the entire rest of the pens team was, and why they are very much in a rebuild now. I also quite like how this model (correctly) attributes all of the goals Hyman was on the ice for to McDavid, he will be on the ice for offense regardless of who you put him with, Hyman on the other hand, not a *bad* player, but not elite. Then the majority of the rest of these lists are star players, Svech, Kap, Panarin, Burns, Boldy, Mack, Tkachuk, EP, Kuch, Bouchard offensively, Hughes, Robo. Even Lekhy and Verhaegahe, while not super stars are usually analytical darlings that tend to cause good things to happen for their respective teams. Fast and Drury being on there surprised me a bit, but well... Canes gonna Cane I guess, then Kuzmenko I know had a great year, and graded out well in the rel league model as well, but man, did not think he was THIS good.
The next thing I wanted to look at was how repeatable each of the rel line stats are. I wanted to look at how they did regardless of their systems and structures because that is what I was trying to measure. So I filtered my data set to only players who played for different teams in consecutive seasons. Looking at that data, I was still expecting rel line to be somewhat predictive buy it was only very slightly predictive:
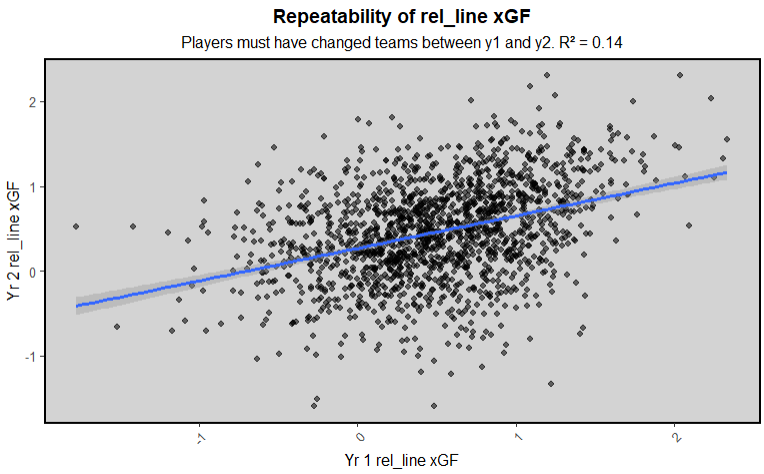
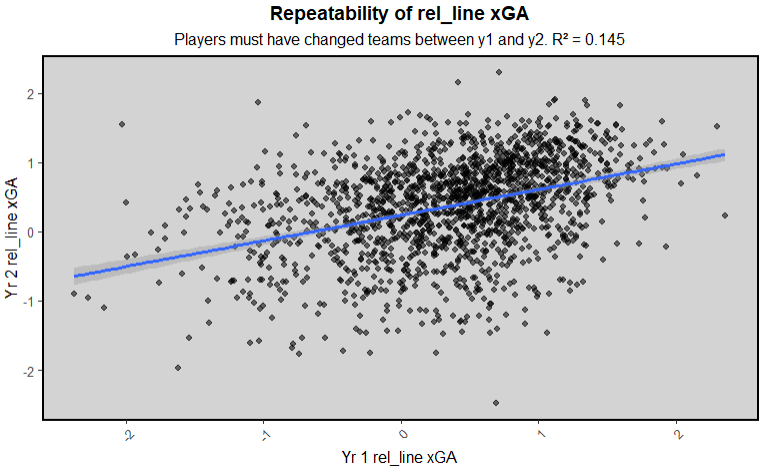
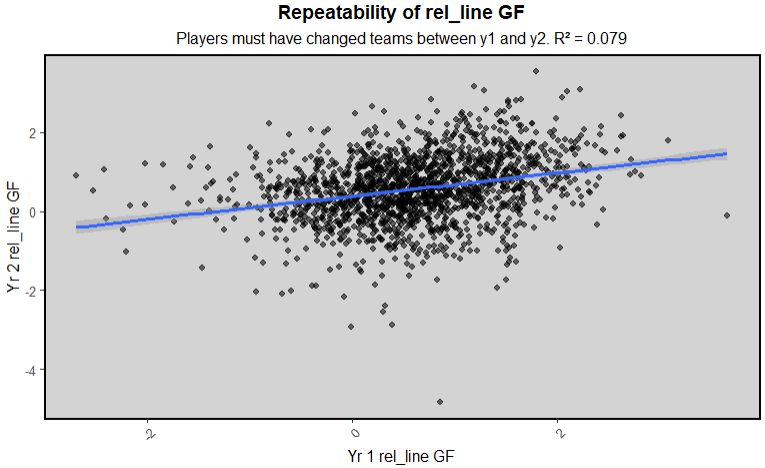
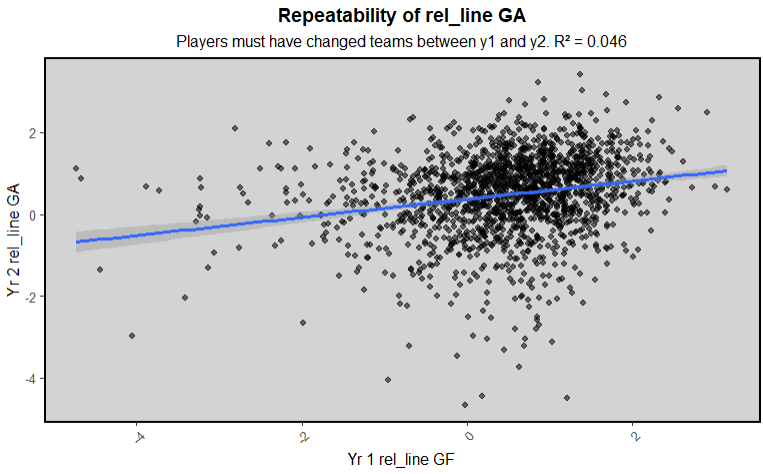
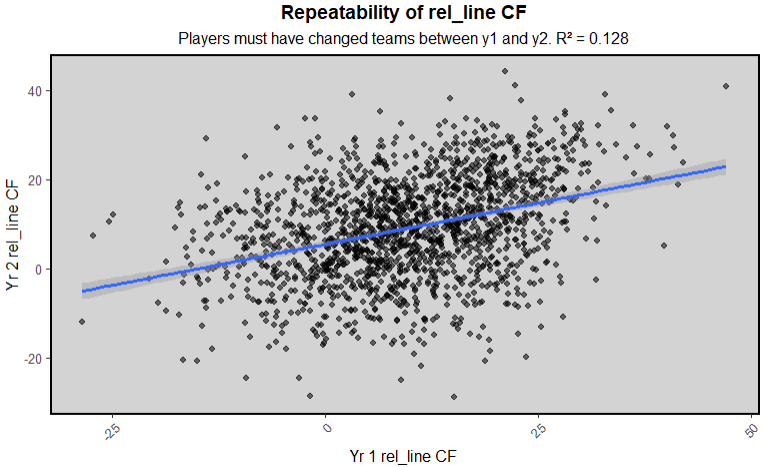
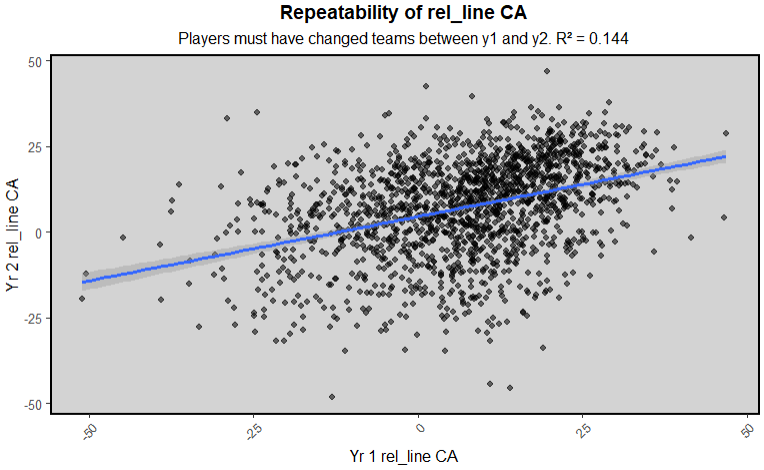
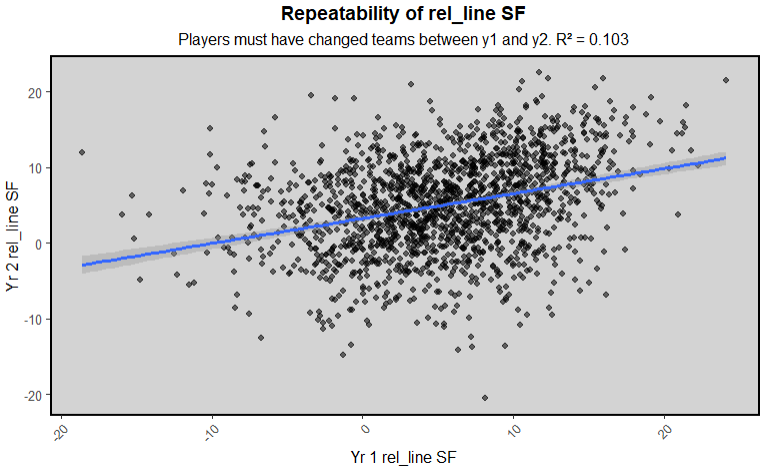
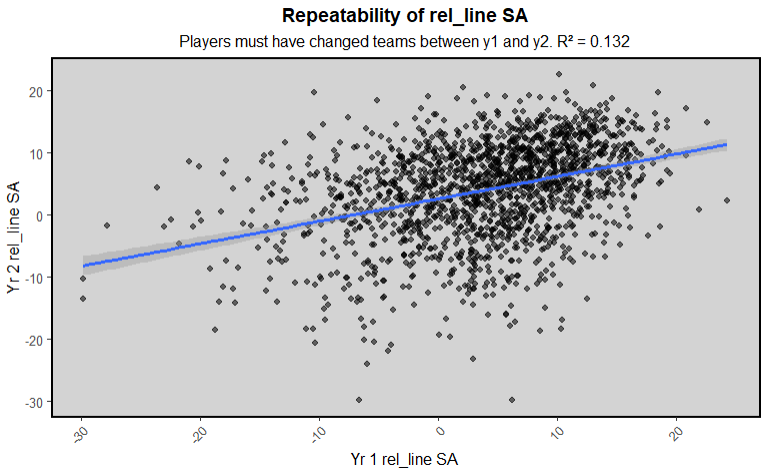
All of the stats were relatively similar, and followed the trend of the other two: xGF and xGA decently predictive, CF and CA a bit less so, and GF (and GA) very much less so. The xG ones and the CF ones I still see a clear upwards trajectory, though that could be skewed by the trend line making it more obvious, but I feel like my eyes have been trained well enough to notice trends in dot plots. There seems to be a stable line of under-performers who all had a bit under -1 xGA/xGF rel line, but had anywhere from -1.5 to 1.5 rel line xGA/xGF in year 1 that probably drop the r2 down. Then in CF and CA the blobs are clearly more spread out, but still seem to generally go upwards. Then for GF and GA I guess they slightly go upwards, but if the trend line wasn't there I would say there's basically no correlation. Which I would tend to say makes sense because the on ice shooting talent of their lines wasn't accounted for in this, and changed entirely when the player changed teams. Similarly the goaltending also would have changed behind all these players, so I wouldn't trust the GA in most stats if I'm being honest, regardless of who makes them.
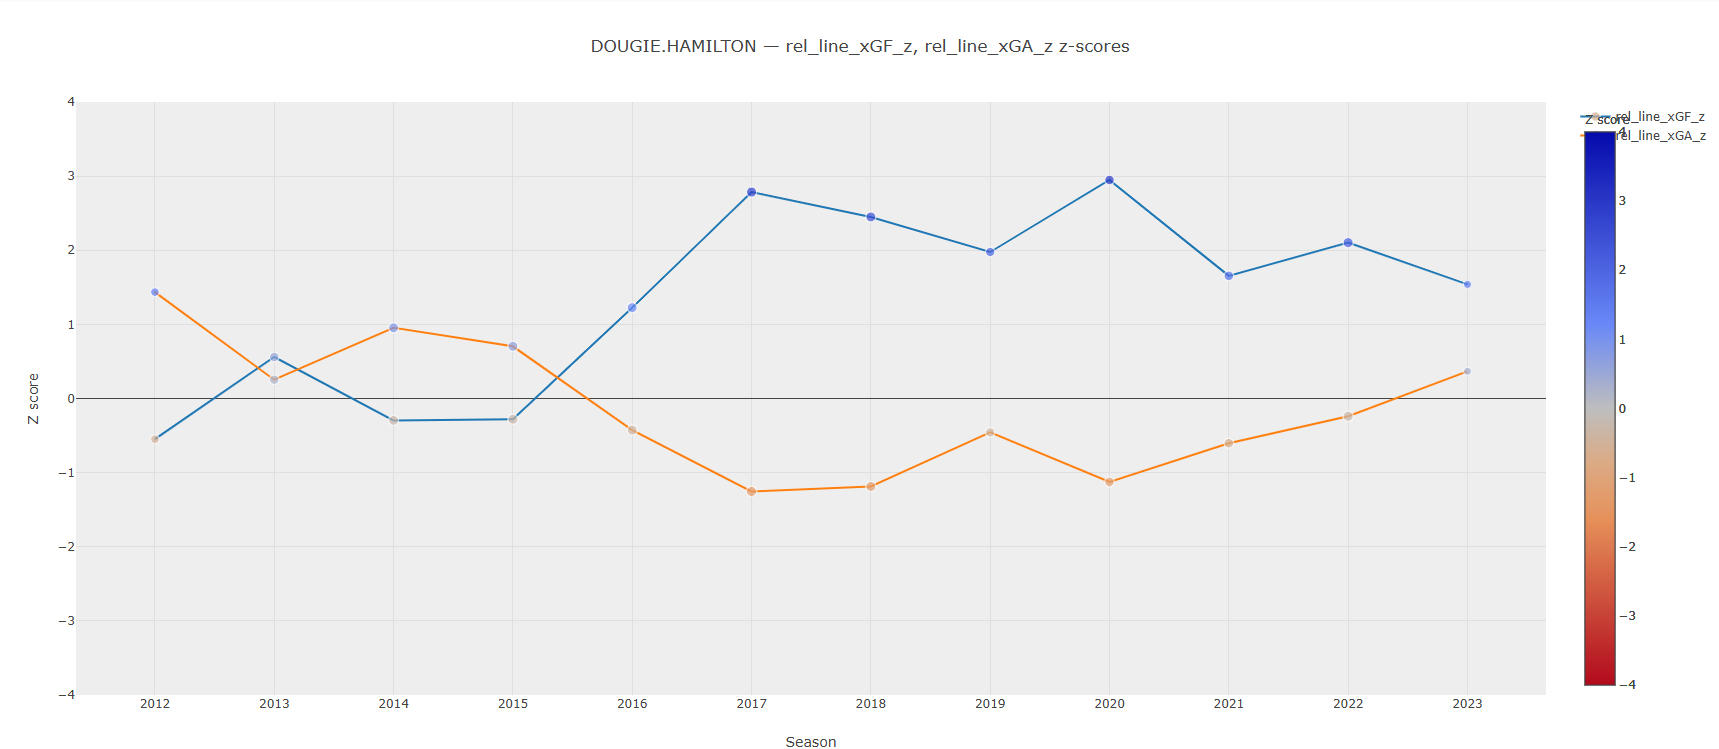
Just wanted to shout out another player who I like and has done good throughout their careers with this part. It's the same chart, as in the RAPM and rel league writeups, so I'm assuming you will have played around with that by now. If not, it can be found here. It just lets you choose any stat and look at their z scores in it throughout their careers. Dougie was an incredibly consistent performer offensively throughout his career and not too shabby defensively.
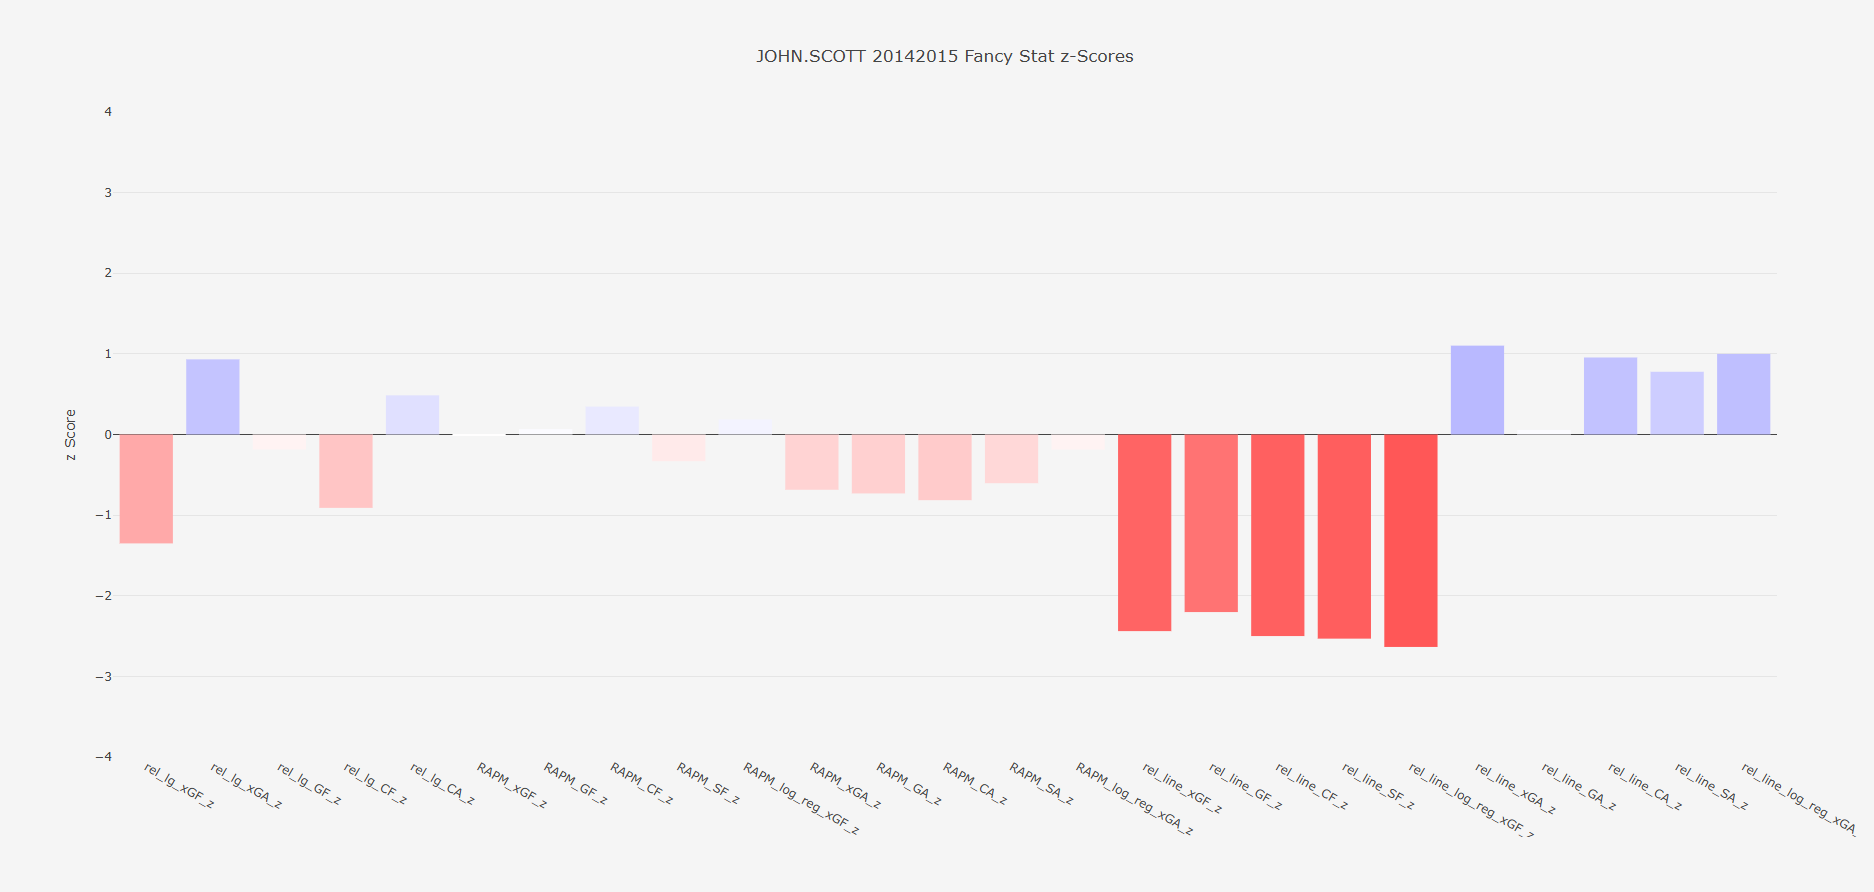
The single season charts are probably more fun to me. They show more than rel league stats, they show how the player did by almost any stat I made, which shows that John Scott probably should have been an all star. Especially by the rel line stats that I'm talking about in this article, he was HORRIBLE offensively, and that's usually how stars are judged. I've been choosing one good player, and one bad player for each of these articles, but I kind of ran out of bad players/jokes that I don't think would offend anyone. But then I remembered John Scott was an all star because he was bad. Nobody, not even the man himself would say he was a great NHLer, so here we are, my stats prove that he was in fact, not a great NHLer.
Data
I did get most of my shot data from evolving hockey's querey feature. I hae tried to run scrapers to get data directly from the NHL api, but it's always been a mess every time I've tried to build that scraper in particular. I've built many others succesfully, but just never one for the NHL API. So the EH queries are the next best thing, and they come mostly pre-cleaned. Though they were behind a paywall, I feel like I've done enough data manipulation that I can share this, especially in a portfolio style website that I don't plan on being profitable from.