Overview
One of the other stats I thought of while making the RAPM model was a "relative to league" stat, where I compare a players value in a stat to players in similar situations around the league. Because my KNN model for xGs was so successful, I wanted to try doing something similar for players to get a more detailed look at how players did relative to the context of who they played with. I useda similar set of stats to RAPM, but simplified it even more because I (correctly) figured this would take even longer to run, so I only looked at TOI and who the player played with for this stat and didn't further split by game score.
Instead of running a regression model and taking the coeffecients as the player ratings, I ran a model to predict how well an average player would do in the exact context a player played in, then took the difference of how the player actually did and how they were expected to do. I calculated the "expected performance" by making a KNN model to predict the xGA, or xGF or whatever, using the input of the players most common linemates, and what their respective xGF, or xGA, or whatever were. I had a massive dataframe with every single player in one column, then their most common linemate in the next, then the percent of toi they played with that linemate in the 3rd. Then their second most common linemate, and the toi percentage with that linemate. Then I followed that all the way down to the least common linemate and their time on ice percentage. I then replaced all of the names with that player's stat (xGF, xGA etc). Finally, I ran a knn model with k = 50 for every player to predict how an average player would be expected to do in their situation. I ran the model seperately for every single year, so I was only comparing to players from that season, not any season, I could see arguments either way, but it took a long time to run the model as is, so I didn't want to 15x the number of possible comparisons so I just kept it at 1 season.
Running all of those regressions took quite a long time to run, so I didn't have time to run the same thing for every stat, so I kept it to only "important" stats: xGF, GF, CF, xGA, and CA. I didn't want to look at GA because I didn't look at goalies and they would be far more impactful on te GA model than any skater could be. Then SF and SA were just too similar to CF and CA and not as predictive generally. Also, this is a totally new methodology compared to anything that I have ever seen before, and as a 1.0/beta version I was pretty happy with it. I'm sure there are issues with it that I haven't fully thought through, but I think for now it is about as "good" as it is going to get, at least while I'm working on it. Now whether it is actually a "good" stat is a different issue that I will look at in the results section by sanity checking the top players and looking at how repeatable it is year to year.
Results
The first thing I wanted to do to check my results was look at the top players in a few stats from the previous season. I got some mixed results, some players I expected to be at the top, especially in the offensive metrics, then the defensive metrics were iffy, I got confused on multiplying by -1 to flip the z scores (less xGA is better, so that would be a lower z score usually) and then couldn't even tell if which side was supposed to be the best and worst players. So I'm not sure how much I trust my RAPM model for defense, but offense it looks solid:
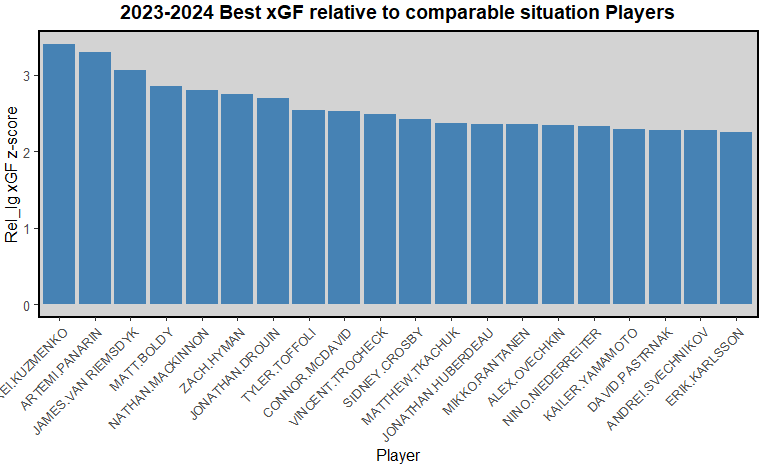
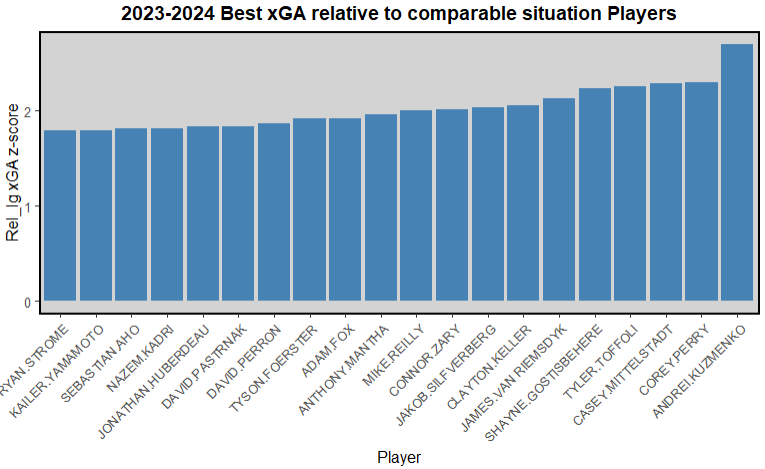
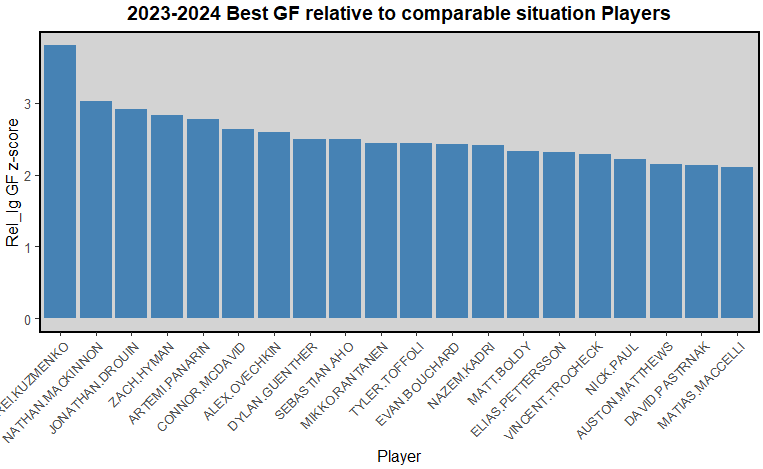
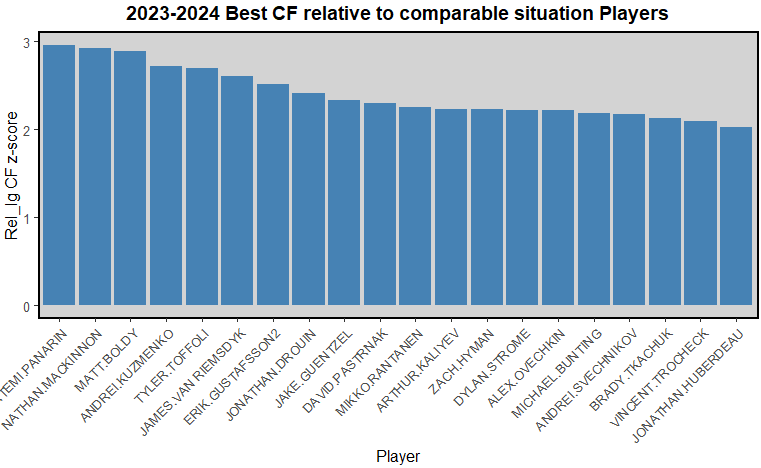
These ones were simultaneously better than, and worse than the RAPM ones in my sanity check. Obviously Kuzmenko leading the league in 3 of 4 main stats is insane, and definately shouldn't happen, though he did have a great season. But aside from him, almost every player in the top for all of the offensive stats is a star. McDavid, Aho, Panarin, Hyman that season obviously, Mack, Guentzel, all of these guys are great, you don't need me, or a fancy stat to tell you that. However, I think seeing Hyman or Drouin up there tells me something important. With normal players, with league average QoT, looking at the 50 closest players gives us roughly 25 wrose situations and 25 better situations. However for guys like Drouin or Hyman who are playing almost solely with mega stars, they probably have some of the highest QoT in the league. Now the model is looking at 5-10 better QoTs, if that, and 40-50 worse QoTs, which will bring the average down, and thus bring the expected value down. Then because those guys are playing with players so much better than that, the model doesn't fully account for them. Then defense was again a mess. Fox and Foerester make sense, Fox is elite and I remember people hyping up Foerester defensively. But then like Silfverberg?? he was like 75 years old, Perry too was close to 100 I think. Mike Rielly also not known for his defense, so I'm really not sure on the whole defensive metric side of this thing too.
The next thing I wanted to look at was how repeatable each of the rel league stats are. I wanted to look at how they did regardless of their systems and structures because that is what I was trying to measure. So I filtered my data set to only players who played for different teams in consecutive seasons. Looking at that data, I was still expecting rel league to be somewhat predictive, and it was, at least compared to RAPM:
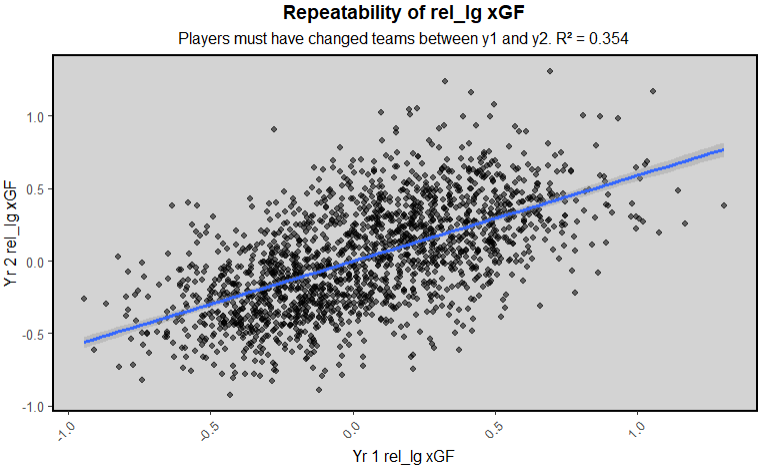
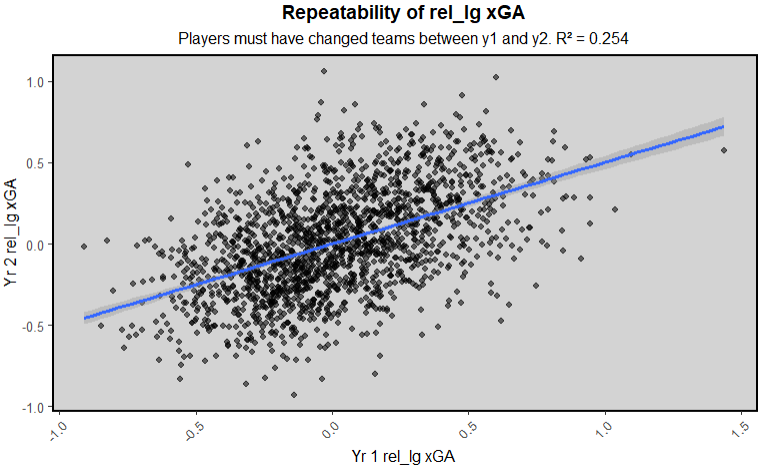
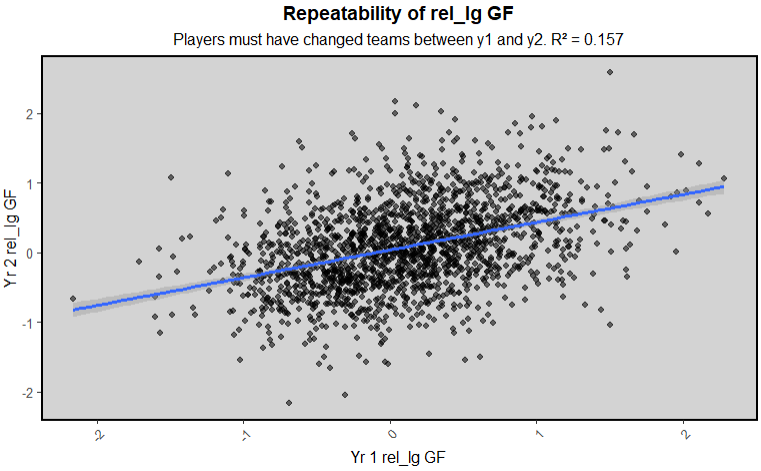
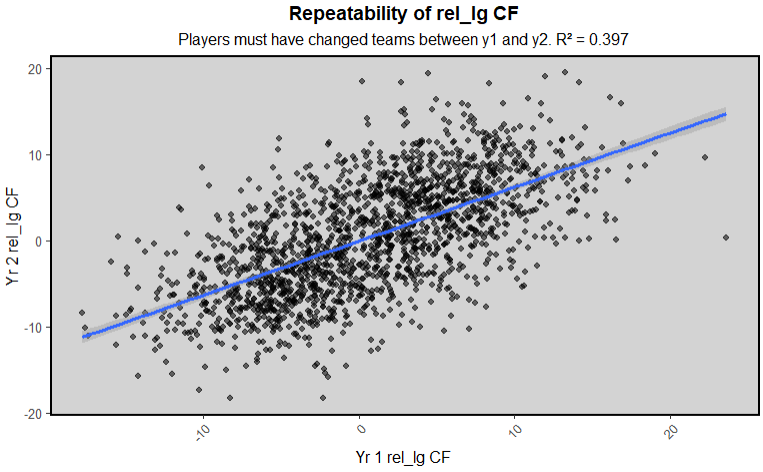
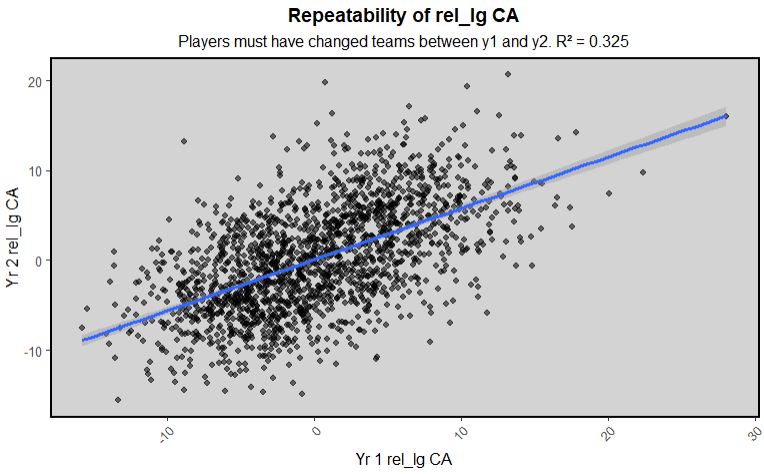
Obviously for rel league I only looked at the most useful stats because I didn't have time to make the rest, and they are generally the most repeatable stats. However, I was still somewhat impressed with how this performed. Especially after looking at the top players lists, I got kind of worried, but aside from GF and xGA, ~1/3+ the variance in y2 rel league stats was explained by just y1 rel league stats. That wasn't even taking a 3 year sample or anything into account, so I was happy with that. Even xGA having an r2 of .254 wasn't too bad, there was still a clear upwards trend, just with some "outliers" who had one good or bad season. With defensive metrics in particular, they are generally less repeatable, especially for Fs, so I wasn't too surprised by that either. It would be nice to look at the difference in how repeatable xGA is split between Fs and Ds, but I didn't do that, maybe I'll look into it next time. Then for GF because on ice shooting is so volatile, and wasn't accounted for at all, it doesn't shock me that the repeatability here was lower. Because on ice shooting impacts goals for so much, and changes so much year to year, and one player generally has very little consistent impact on their on ice shooting, this didn't shock me. This is also why I don't like using goals against, because goalies are even less in the control of the skaters, and might be even more voodoo/volatile than skaters shooting. There was still at least a clear positive trend with the rel league GF as well, it wasn't like it had absolutely zero predictive power like most of the RAPM stats.
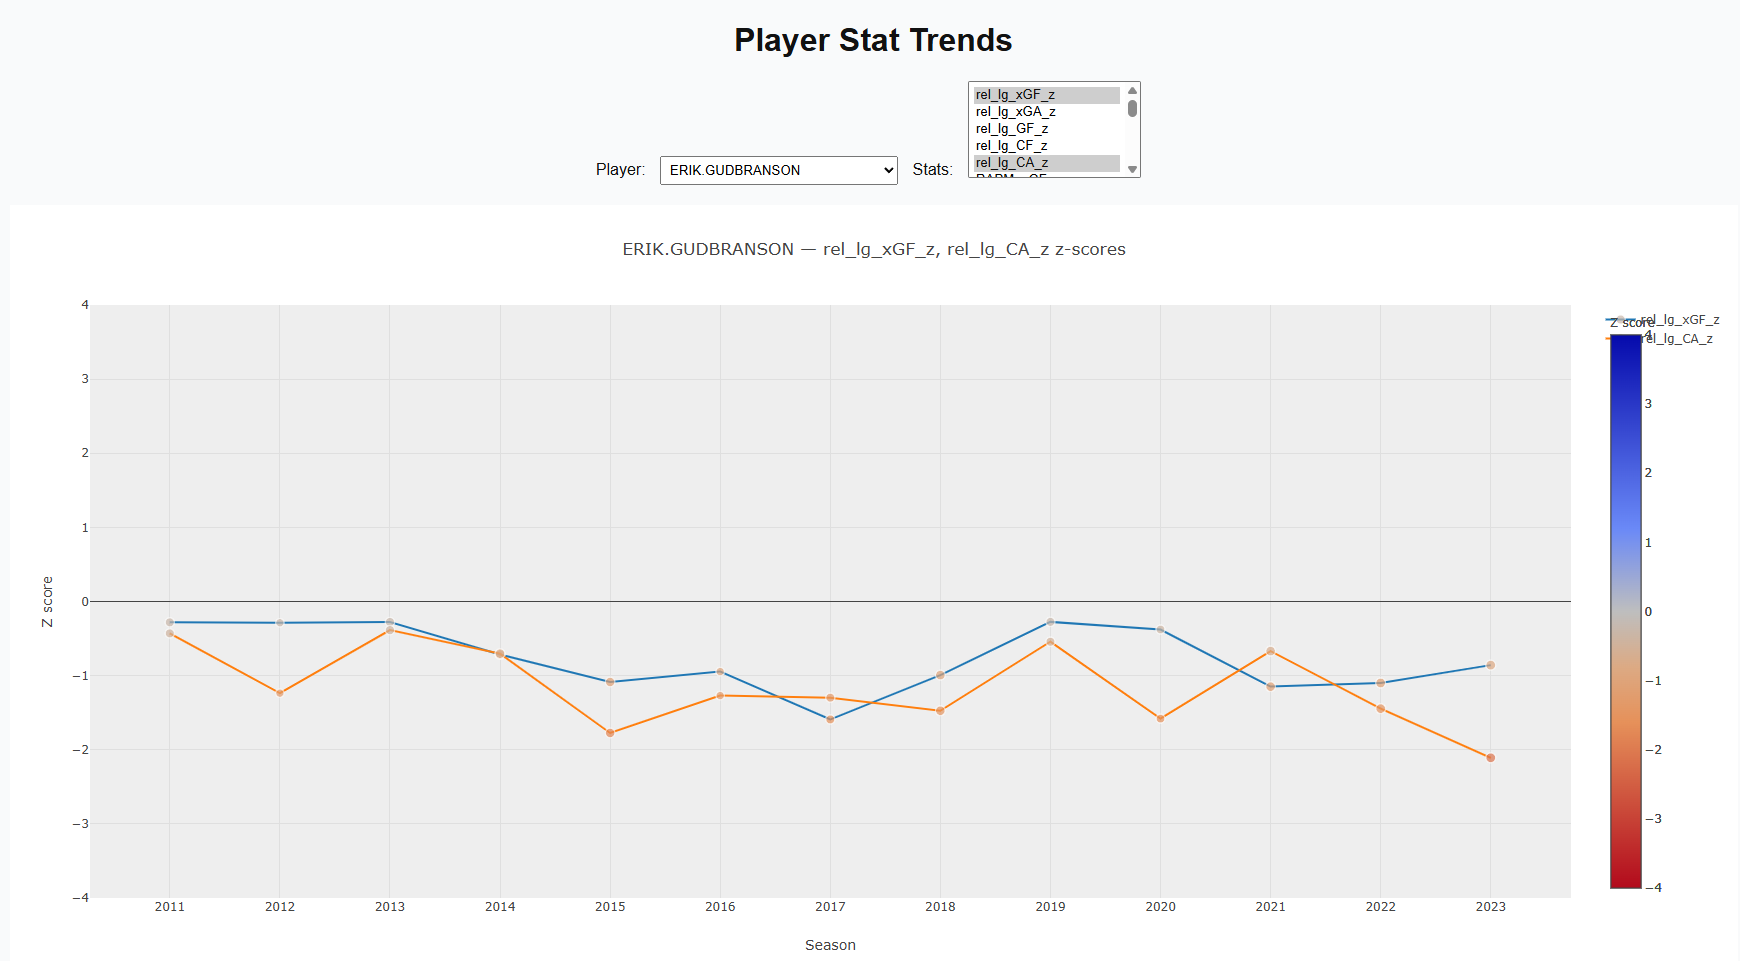
Similarly to the RAPM career chart, you can find it in the same place, here. So here is an example of a much less succesful player than Datsyuk. I liked some of what Gudbranson brough to the pens after a while, but again that was yet another befuddling move that helped to spoil the last few years of the big 3's careers.
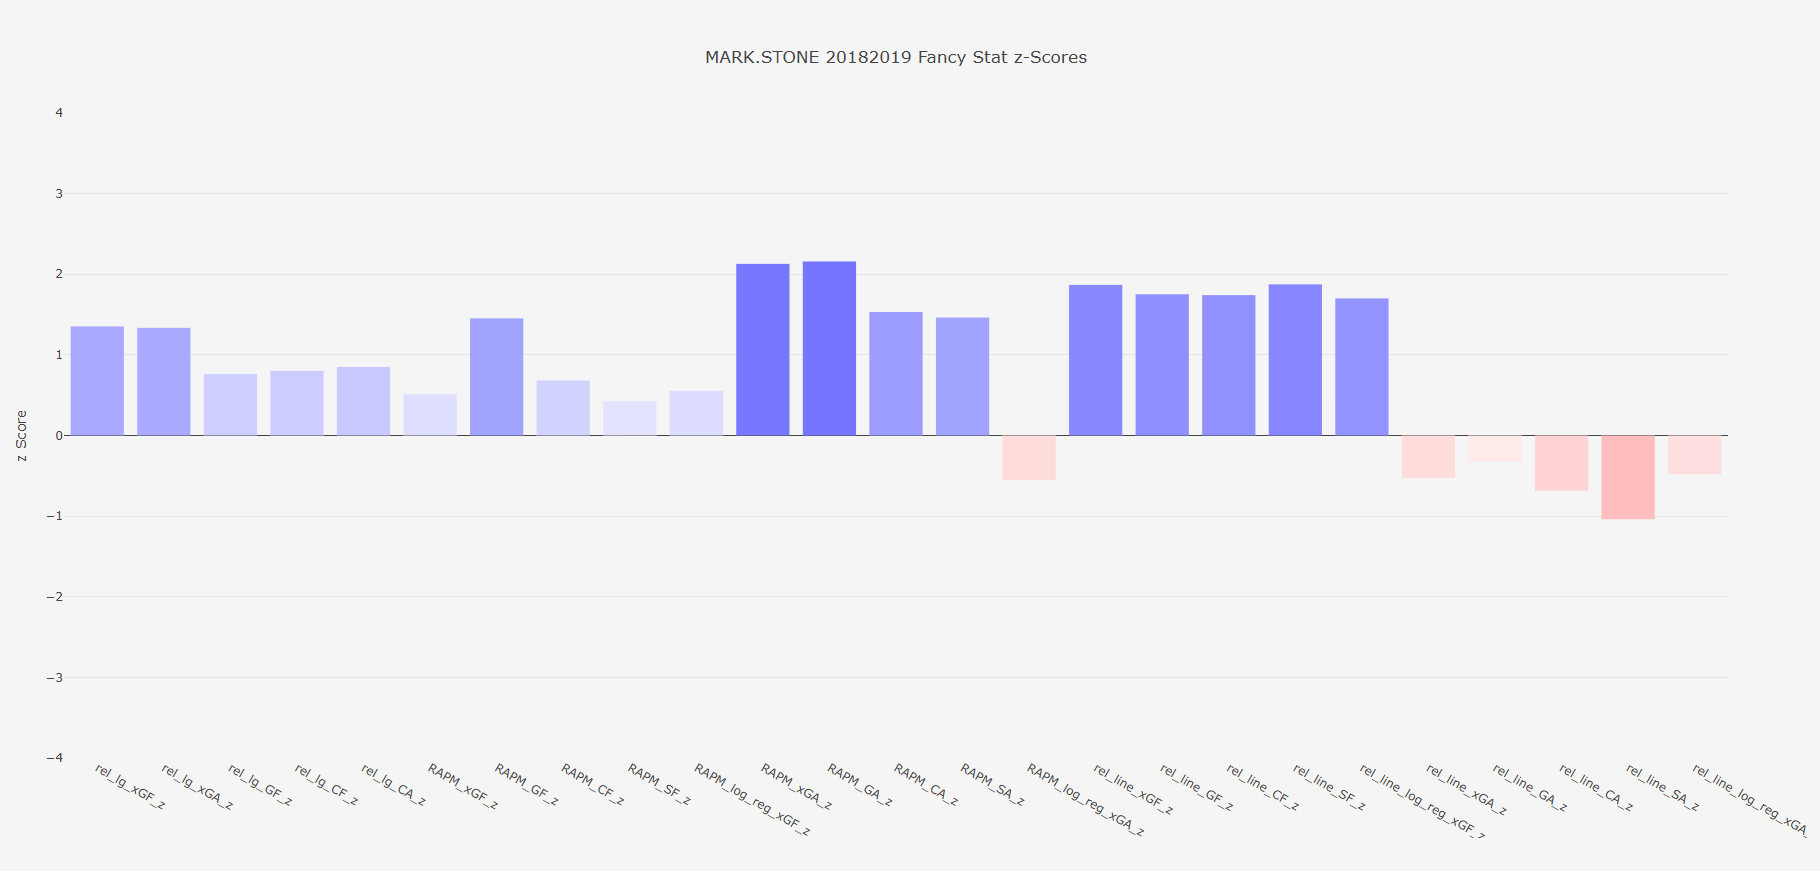
Then for the player I want to shout out with my single season chart here is Mark Stone. Man may not be the best skater in the world, but he is so smart, and his stick checking is insanely funny to me. He just always drives play in the right direction, and almost all of my stats show that. He doesn't grade out particularly well in the rel line defensive stats, but aside from that just consistently one of the best forwards in the game both offensively and defensively.
Data
I did get most of my shot data from evolving hockey's querey feature. I hae tried to run scrapers to get data directly from the NHL api, but it's always been a mess every time I've tried to build that scraper in particular. I've built many others succesfully, but just never one for the NHL API. So the EH queries are the next best thing, and they come mostly pre-cleaned. Though they were behind a paywall, I feel like I've done enough data manipulation that I can share this, especially in a portfolio style website that I don't plan on being profitable from.