Overview
After the draft I wanted to move on to building a predictive model for the NHL in the 2025-26 season. I initially went into this project with high hopes and lofty goals and expectations. Then a few weeks later it all came crashing down after numerous setbacks, incredibly frustrating data merging issues, complete and utter lack of early success, and a slight math misunderstanding when I started. The initial goal was to take just about every stat I could find, points, WAR and its components, RAPM stats, and all the raw advanced stats and see how well having the better player, and how well the difference between the two players/groups at each position/group correlated to winning. Then I wanted to look at all of those same stats but for players to try see how well they correlate year to year to predict each players stats this year. Then I would finally take the projected lineups, all of the predicted stats, and the teams schedules to predict game by game who would win/the odds of each team winning every game to get standings predictions.
As you can see by the fact that this is my only piece talking about standings predictions and it does not in fact include standings predictions, I did not get that far. I started by collecting the toi of every player in every game played since 07 because I wanted to use that to determine who was the number 1C or 2C etc in each game. That would be better than using just the total TOI over the season, because if someone got hurt and had the 3rd most TOI as a C, but in the games they played they were the 1C they would be marked as 3C in all games, ones where they didn't play and ones where they did, but as the 1C, so I needed to take the time to get game by game toi. That still wasn't perfect because there was nowhere that listed player positions game by game since 07, just season by season, so there could have been games where there were 6 Cs and only 3 of each W or whatever, but there wasn't really a way I could solve that with currently available data. I figured that wouldn't be a major setback because mose games there would still be at least 3Cs and 3 of eaech W and usually 6 Ds. The results for 4th liners may not be the best, but the other three lines should still have solid results. My next step was merging the databases with the toi data (from hockey reference) and the stats (points) from eliteprospects. Unfortunately those two datasets didn't have matching player IDs, so I had to merge by names, which caused so, so many issues. Players official names changing, some sites love using Alex instead of Alexander, or Andrej instead of Andrei, or Matt instead of Mathew, or any other number of issues, not to mention Colin White, Sebastian Aho, and Erik Gustafsson, they neeeevvveerrrr caused issues. That was an incredibly frustrating setback, but eventually I got through it and moved on to the next phase, with a lot less patience and a lot more frustration. Especially after having to do a lot of the merging twice because of a crash in r before I could save the csv.
I then finally had all of the data, so I was able to run the predictions, which again took longer than expected, I knew there were a lot of games in the NHL since 07, but did not think it would take that long to run the model for each position. I then created a model that used the difference between scoring at each prediction to predict how likely each team was to win the game. Because I went position by position, instead of simply adding the next line down, I got massive cofounding issues. Obviously the team with the better 1D is far more likely to have the better 2D, then the team with the better top 3 Ds are more likely to have the better 4D and so on. I did try to fix that when moving on to EVO WAR (after another few days of merge conflicts, with TDH's WAR database) by looking at the simple probability of a win given the team has the better 1D, then looking at the change when looking at top 2Ds, then top 3Ds and so on, to estimate the impact of each individual roster spot. But then I got such small increases that they were essentially random, and likely not statitically significant, even relative to each other. And they were certainly not significant enough to cancel out and uncertainty brought in by projecting the stats for next season if I had moved on to my original goal of creating a model to predict the standings for the 25-26 season. I also did a similar thing, but for player groups instead of individual players, so top 6Fs, top 4 Ds, each line as a whole, but also got very similar, highly suspect results. I then basically rage quit on this project, I simply wasn't enjoying working on it anymore, the results I was getting were flawed at best, and I would have had to redo more data merging if I wanted to look at any other stats, which I REALLY REALLLY REEEALLLLYYY did NOT want to do.
Results
Looking at the results, position by position, we unsurprisngly see "depth" playing the most important role, because, unless you're Seattle and youre first line is usually going to be much better than your fourth line.
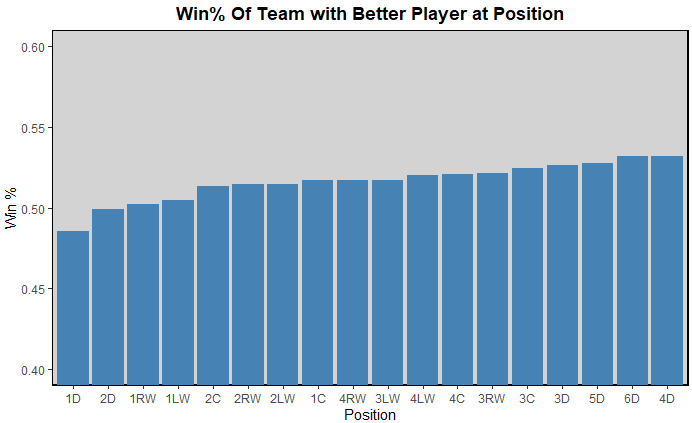
Obviously, your bottom 4 Ds are not the most important players on the team, they just appear as such because the team with the better 3D usually has the better top 2Ds. So the 3D bar is moreso measuring what is the win% of a team with the best top 3 Ds, but not as effeciently as just measuring that specifically, because there are still cases where the 3D is better than their oponents, but their top 2 Ds aren't. That is where the main issue with this project came into play because it simply wasn't measuring what I initally planned to measure. The one notable thing that was useful was that the team with the 1D who had more points won less than 50% of the games. I don't really know what to take from that, other than points for defensemen are not particularly useful, but it still quite surprised me.
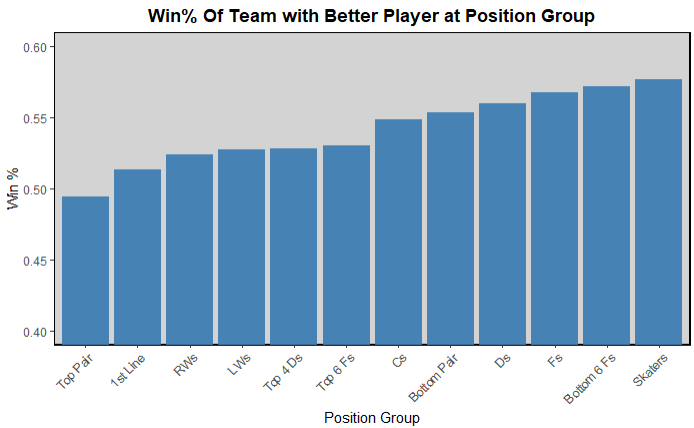
Then looking at random position groups, this was potentialy more useful, depending on which group you are looking at. You obviously run into the same cofounding effect with the bottom 6, but it is interesting looking at position groups as a whole, that having the better Cs increases your win% by a bit more than 1% more than having the better of either W does. Also your top 6Fs and top 4 Ds have very similar impacts, makes sense, but was interesting to see. Then seeing that the team with the higest scoring skaters, on average still only wins under 60% of the time was interesting. Would maybe be interesting to take the weighted average based on TOI instead of simply the average scoring of all of the skaters, and compare those, but that is a project for a different time.
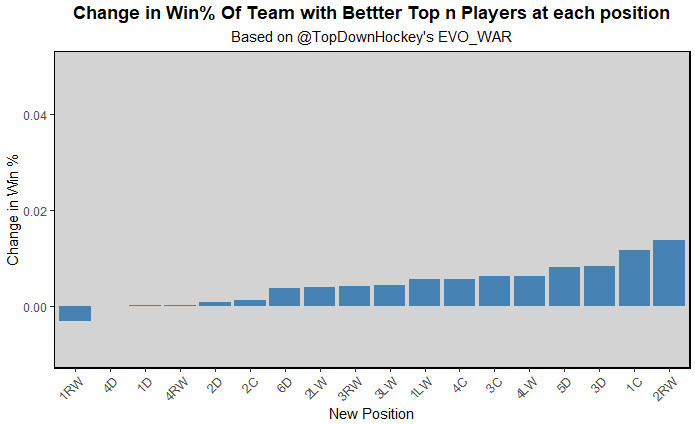
Next, I looked at EVO WAR from TopDownHockey, and did basically the same thing, but with one slight change. For every position, instead of looking at just that position I looked at that position, and all the positions above it (so for 3C it would be 1, 2, and 3 Cs instead of just 3C). There are still issues with that, like if Edmonton played Seattle, McD and Drai are so much better than McCann and Beniers that it doesn't matter if SEA's 3C is better, EDM's top 3 Cs will still be marked as better. This still wasn't measuring exactly what I wanted, but at lesat there weren't objectively incorrect mathematical assumptions. I then looked at the difference between the 3C and 2C rating, or 1C and 50% (baseline average because no ties, and I didn't look at home ice advantage). The RW one was odd to me, why would having the better 1RW decrease your odds of winning, do teams like to spread their talent across the top 6 always drop the best RW to RW 2 which shows up as the most important position? Aside from that, you see 1C as the most important position, which is good and makes sense, then some D positions, which while they don't make sense, I'm using an offensive metric to judge defensemen, maybe it would be more similar to expectations for d men if I looked at WAR or EVD or RAMP xGA or something. Then you see a lot of depth forwards instead of the rest of the top 6, which just shows me either A. EVO WAR is not good at predicting who wins the games, B. There was something wrong in my methodology that I couldn't spot, C. Coaches are stupid and not playing players in the right spot, D. Depth is significantly more important than we think relative to high end players, E. No one position is that important so none of this really matters in terms of predicting games, or E. A little bit of all of the above (most likely). I could have tested some of my theories looking at total WAR, and how well EVO WAR predicted which team was likely to win based off of skater groups, similar to what I did above with points, but I believe it was shortly after this that r crashed and I just didn't want to deal with any more merge conflicts, resetting code, re-running old code to get to where I was, and anything else to do with this project because I simply was no longer having fun with it.
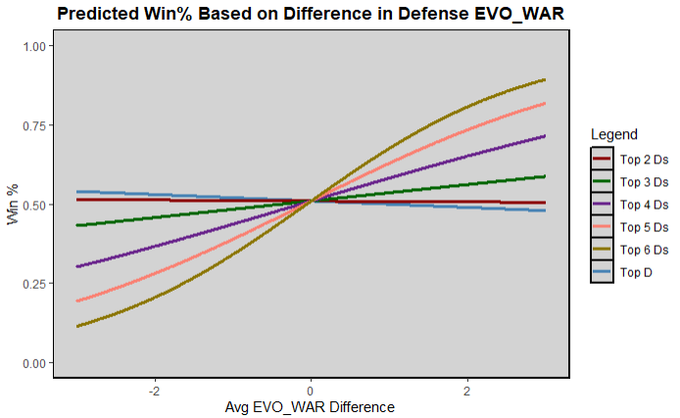
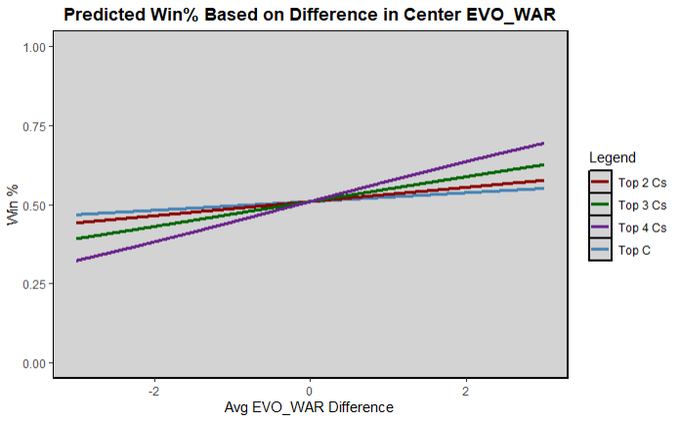
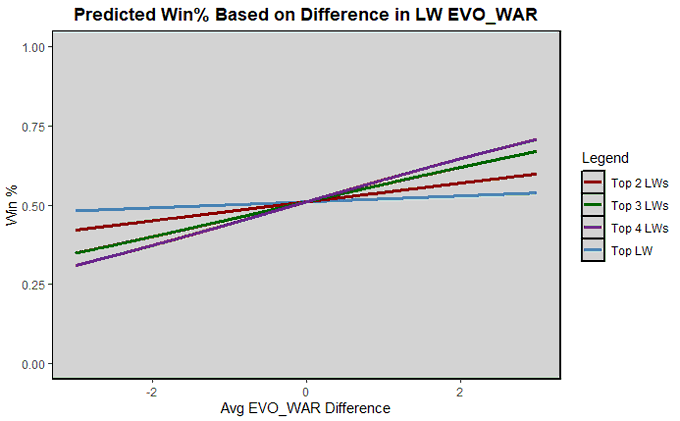
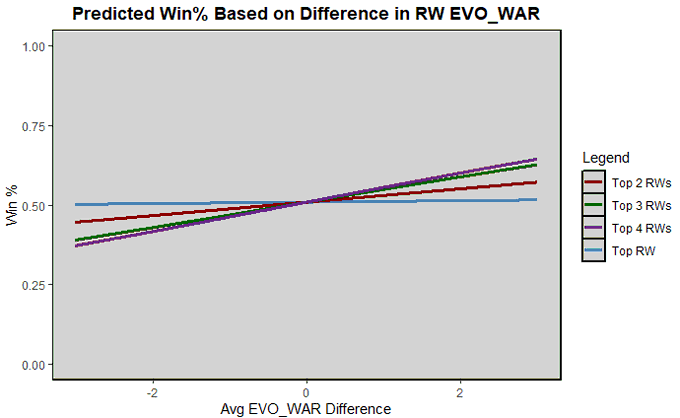
I was still able to create these charts, which predicted how likely a team was to win a game given their top N players at a position were better than the opposing teams top N players at that position by a certain amount. I created a logistic regression model for each position to plot the win percentage given the difference in EVO. As you can see, most of them still have very small changes in win percentage, even for unreasonably large differences in average EVO. Going back to the Seattle vs Edmonton example, the difference between those Cs EVO's is 2.1, and nearing the tail end of that graph, and that is probably about as large of a difference you'll see in a game that doesn't involve one significantly injured team. All of the F positions are relatively useless for most games, giving only a percent or two increase in most reasonable margins. Not saying that isn't important for team building, but when it comes to predicting individual games, there are better metrics. Then for Ds it's quite interesting that overall having a much better d group is noticeably important, but having the better top 2 or 3 Ds does basically nothing for your odds of winning
Overall, this project was largely a flop for the numerous reasons I listed above. A lot of my results were completely meaningless and filled with errors, and the ones that weren't showed differences so small they were basically useless, which is good to know, I answered a question, but not good for their usefulness, or my desire to do this with more stats. Especially after realizing I would have to merge even more datasets together, I just decided this was no longer worth the time or energy for me to pursue, and I wanted to work on more interesting, and potentially impactful projects instead.
Data
I got my data from various sources this time. Points were still from eliteprospects, but the TOI data for each game was from HockeyReference, and I also initially used the TOI data split by teams/season from EvolvingHockey. Then I used EVO WAR data from Patrick Bacon/TopDownHockey/advancedhockeystats.com because I still believe that is the best publicly avaiable WAR model we have.