Overview
This project sprung out as a side project from me wanting to create an NHLe model with slightly different parameters to most models that I'm aware of in the public. I'll go more in depth on that model later, but for this, I figured since I had all of the league and points data I could make a rough league equivalency model.
The logic behind the model was relatively simple, look at players who played in league A (say the AHL) in year 1, and league B (say the NHL) in year 2 and look at the average change in scoring between those leagues. So for example if there were 10 players who went from the AHL to NHL between years 1 and 2, and they all went from 1 PPG to 0.5 PPG the AHL -> NHL equivalency would be 0.5. Obviously that is oversimplified, each player's scoring will change by a different ammount, so I took the weighted average of the change in scoring for all of the players, with the weights being the GP in the first league. Now not every league, say U14-AAA, will have players go directly to the NHL (and we are measuring NHL equivalency, not 15U-AAA equivalency), but we can use a similar concept, just chaining the results. So if the average drop between the AJHL and the NCAA is from 1 PPG to 0.5 PPG, then the average drop from the NCAA to the NHL is also 1 to 0.5, the NHL equivalency would be 0.25 for the AJHL
Now that was a very oversimplified example, because there could be many different ways a player could get from the AJHL to the NHL, say with 1 stop in the NCAA, 3 stops in the BCHL, NCAA, and AHL, 2 stops between the WHL and AHL, or however else. The way I handled those cases was to weight each connection (year 1 league to year 2 league) by the number of players in that connection, so for example the weight for an AHL -> NHL connection will be far stronger than a USHL -> NHL connection because many players plays in the AHL right before the NHL, but very few go directly from the USHL to the NHL. I also "punished" chains that were more complex by decreasing their weight by the number of connections, so a direct AHL -> NHL path weighs more than the AHL -> KHL -> SHL -> NHL potential path.
There is one glaring weakness that someone could point out if they have looked at other NHLe model writeups before, like this one from Patrick Bacon where players develop from year one to year two, especially at younger ages. However, I attempted to mitigate this issue by creating an average delemopment coeffecient for each league, which simply looked at every player who played in the league 2 years in a row and divided their y2 PPG by their y1 PPG to get how much they "developed" during that time. That isn't a perfect fix, because not many players play multiple years in a league like U14-AAA, and the aging curve in pro leagues like the NHL is certainly not standard across all ages and positions. However I figured this would be a better solution than looking at just players who played in 2 leagues in the same year, because A. development still occurs within a season, and B. this vastly increased the number of data points in each connection.
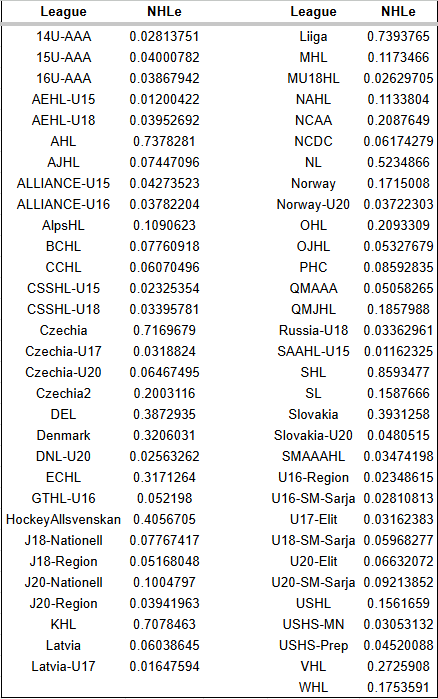
Similarly, I did only look at connections that had a certain number of players between them (I think 25 for the overall model) and each player must have played at least 10 games in a league to "exist" in my dataset, so that minimized most small sample outliers I think. The results of this measure are in this table:
Part of the reason I wanted to use year to year transitions, instead of same year transitions is because I needed the larger sample size to get a league strength over time metric. We all know that leagues don't remain the same strength forever, rules change, the NCAA allows CHL players, Russia invades Ukraine and a lot of foreign players leave, and just genera ebbs and flows of talent coming through a particular country or region. To put it another way, it doesn't make sense to weigh a player jumping from the KHL (Russia) to the NHL in 01-02 the same as in 2011-12 or 24-25.
To do this, I did basically the same method as above, but broke the dataset down into 5 year chunks, so from 00-05, 01-06, through to 19-24, and got the coeffecients from each of those datasets, which you can look at in the league_strengths_plot tab. As with the above overall chart, the number does have a meaning, where 1 is the strength of the NHL and the number is the PPG of a player would have been expected to score with 1 PPG in their current league, or alternatively, how many NHL points each point in that particular league is worth.
Results
I think the main league equivalency model "makes sense" relative to my prior expectations/what I could tell from building the model. The top leagues are the SHL, Liiga, AHL, Czechia, and the KHL. Now the KHL does seem low here, but I do belive that the past few years it has significantly weakened, and I also forgot to combine it with the "Russia" league from the early 00s, which were also some of its strongest seasons. Similarly, I feel like the AHL is generally considered the number 2 league right now, but over the course of the past 25 years, seeing it come in as the 4th hardest league to score in doesn't shock me (NHL is stil number 1 of course)
Now for the year by year league strength model, I feel like there are more issues, smaller sample size could lead to less certainty in the model's predictions, but I think most of the issues could be exemplified by this chart:
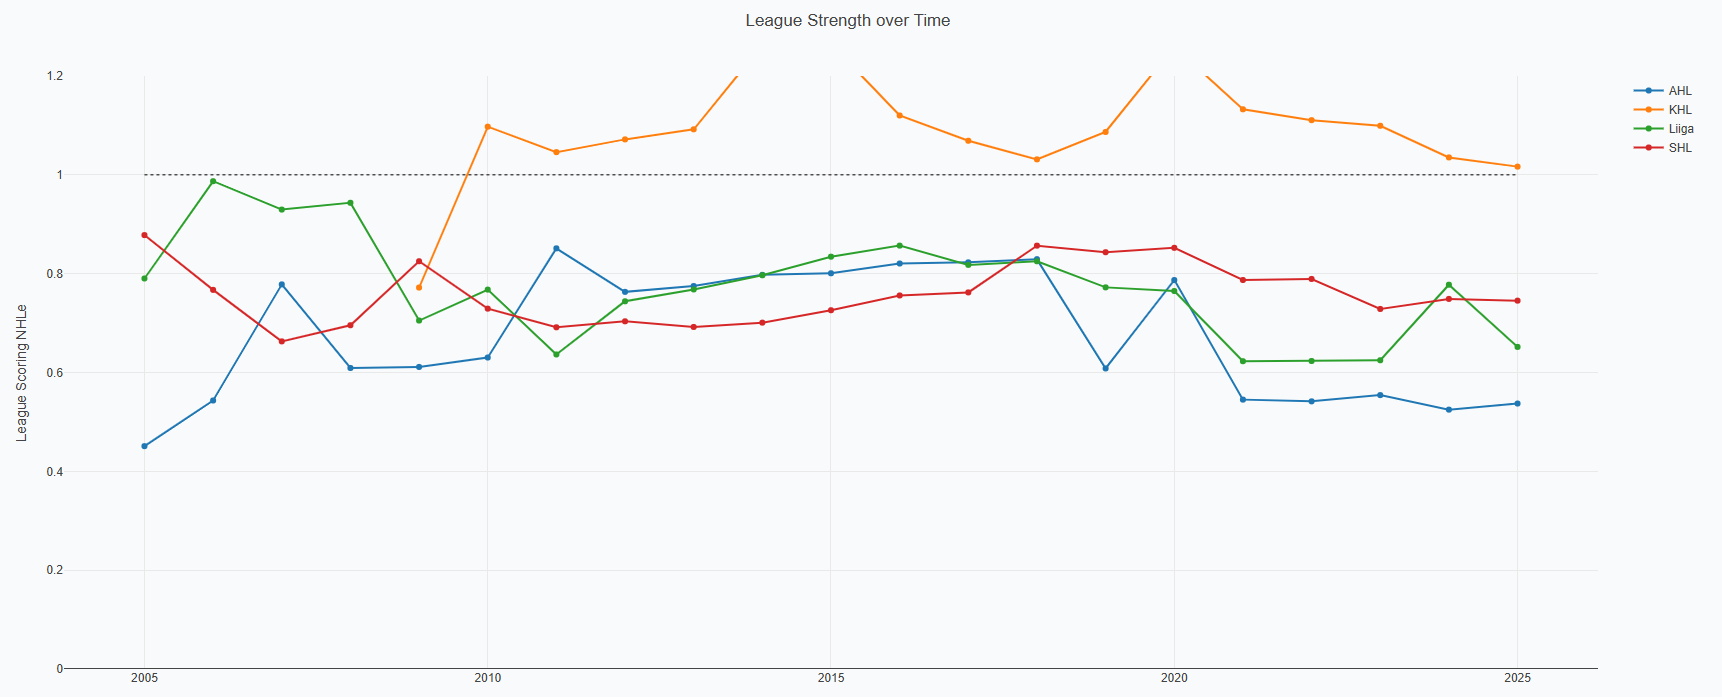
The KHL should not be a significantly harder to score league than the NHL. I do think this could partially be explained by the KHL being generally lower scoring than the NHL. Because if there were only 4 goals scored per game in the KHL, but 8 in the NHL, each point in the KHL is inherently about 2x as hard to come by as a point in the NHL (those aren't the real numbers, just an example for easy math) which makes it harder to score in, however it still shouldn't be that much harder to score in than the NHL. And because I only adjusted for league scoring rate to the 23-24 season (simply multipled a players points by the ratio of average goals per game in one season and average goals per game in the 2023-24 season) lower scoring leagues will still appear to be harder to score in than higher scoring leagues of equal strength. Those were also the peak years of the KHL I feel, and bolstered by a bunch of NHLers during the lockout in 2012 could have skewed the numbers a bit for the surrounding seasons.
Another issue pointed out by that graph is the drop in the AHL being sharper than the drop in the AHL and Liiga. While I do think it's reasonable that all of those leagues have dropped a bit, I feel like the similarity between the structures and systems in the AHL have led it to "keep pace" with the NHL more than the other European leagues. At least for prospect development, the translatability from the AHL to the NHL seems to be holding pace better than that between the SHL and NHL in recent years, from what I have noticed. However, there are so many players going from the AHL to NHL that I could just be skewed towards remembering mostly the successful players, and not the guys that score 0.5-0.75 PPG in the AHL then come up to the NHL, play 10-20 games and score 1 point then get sent back down.
However, I don't think the year over year charts are all bad, there are some good examples in this chart:
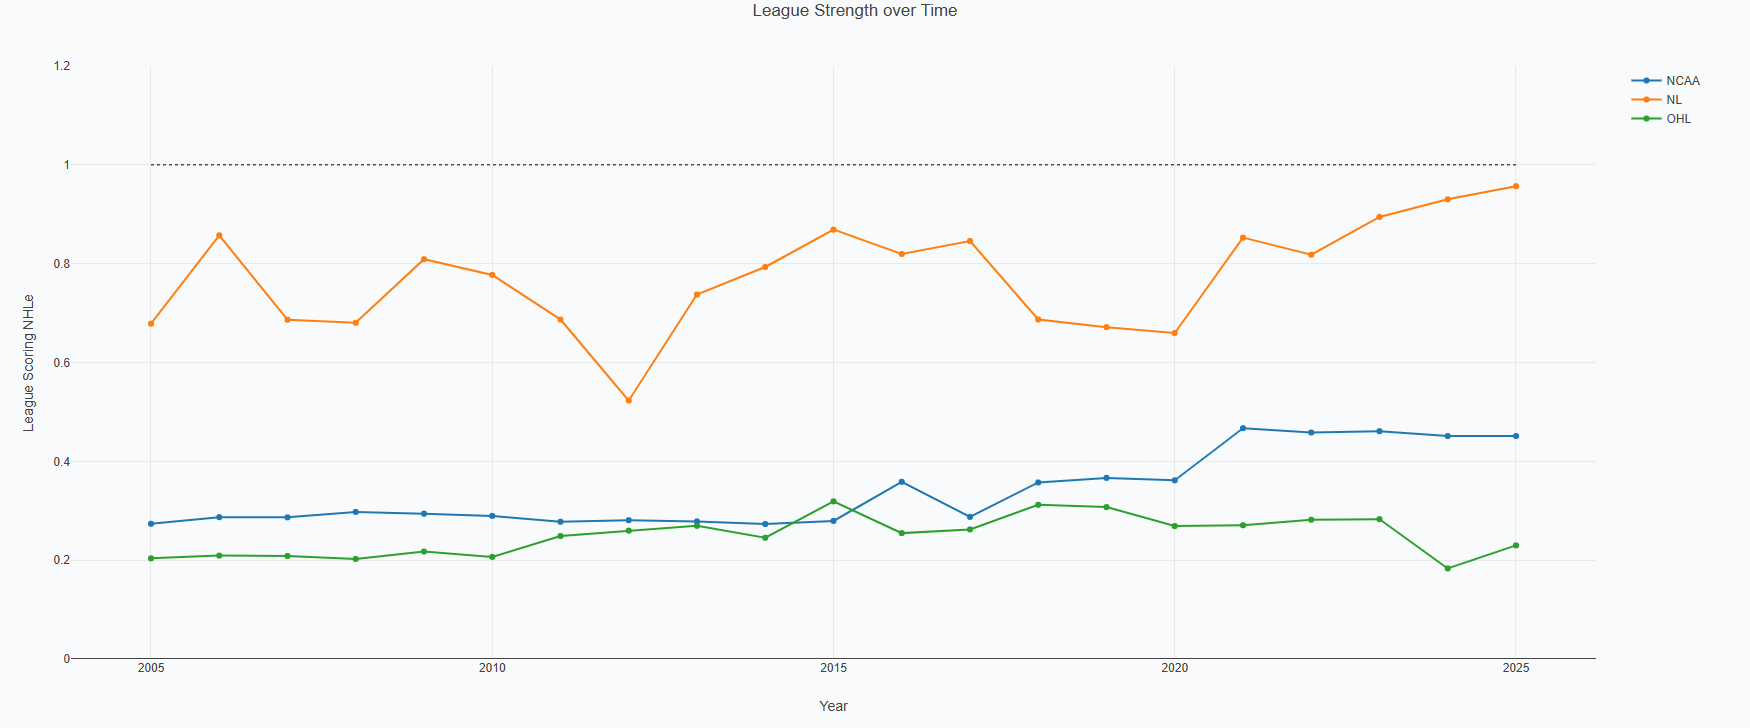
I like that the NCAA has went from roughly equivalent to the OHL/other CHL leagues, to now being kind of in a tier of its own between most European pro leagues, and Canadian junior leagues, which I think accurately reflects where it stood on the development path pre allowing CHL players in. Obviously that will change the league strength massively as it will admit many younger high end talents into the top teams, likely skewing the league back younger, towards juniors, but also only taking the best juniors players, so the skill level could increase with a slight decrease in size/strength and maturity that you get from the 23-24 yr olds with 4+ years of college experience. But we will have to wait and see how that pans out over the coming seasons.
I also like how the Swiss NL has increased in scoring difficulty over the past few years, I believe they changed their import player rules, allowing more players, and have become a stronger league as a result, now legitimately competing with the top leagues in Sweden and Finland. I have also seen similar results in other NHLe models that I have seen, so that kind of confirms my opinion on this result from my model.
Data
All the stats I got were from elite prospects, points, season, age, and league. I have looked into doing this with other stats from websites like the former pick224.com, which sadly no longer has data, but there was never enough data from enough leagues, or over a long enough time to build solid models off of. Similarly with pro European league sites that track advanced stats for all their players, very useful for looking at individual prospect's performances, but they haven't been tracking them long enough to know how well they translate to the NHL.