Overview
If you can't tell by the rest of this website/my twitter, I tend to enjoy following the NHL draft. Something about getting 7 new players in one day, even if they mostly aren't going to be impact players, or even NHLers excites me a bit. So in my years of following the draft, every year you hear this talking point about a few players: "They played so much with x, who's clearly better/one of the best players in the league, so they can't be that good!!!". Now junior leagues don't have the data tracking that the NHL does, so there is no way to create stats that adjust for teammates or opposition or whatnot, like RAPM and most WAR models. I also don't have the ability to track every shift change and shot attempt and location in the USHL, but I had an idea to do the next best thing. I could at least look at what teams post on social media for their lines before each game and look at players stats (goals, assists, points) for that game. I could then use those stats and line combinations to see what line combinations were most successful, and what players truly did struggle without certain linemates.
Unfortunately, this year was a relatively weak year for the USHL, so there weren't any players that people were really debating the linemate effect for. The best case I got to use this for, as a side effect of tracking lines for every game, I also tracked listed positions for every game, so I could confirm or dispute what various statistic sites list as a player's main position. I also never took the time to make a "RAPM" style model with this data because I wouldn't have the sample size of different line combinations needed to run the ridge regression model. Also, teams do change lines throughout the game, injuries, penalties, just simple poor play, so that would throw massive error into any model built using these stats. Finally, I was only able to track the USHL lineups, not OHL, Q, W, or NCAA, which I may try to look into figuring out an easier way to track them for next season.
While I wasn't necessarily able to make the stats I initially indented to when I started tracking the line combinations, I was still able to get some interesting results. I was able to calculate each players PPG with and without their most frequent linemates, what rough percent of time they spent at each position, a very rough estimate of their P/60, and which line combinations were the best in the USHL. All of which, while maybe not the most useful, can be at least somewhat interesting, and the positional one could be quite useful, especially if one wanted to look at a players performance splits between certain positions.
Results
First, I wanted to look at the top producing lines, in terms of both PPG and total points.
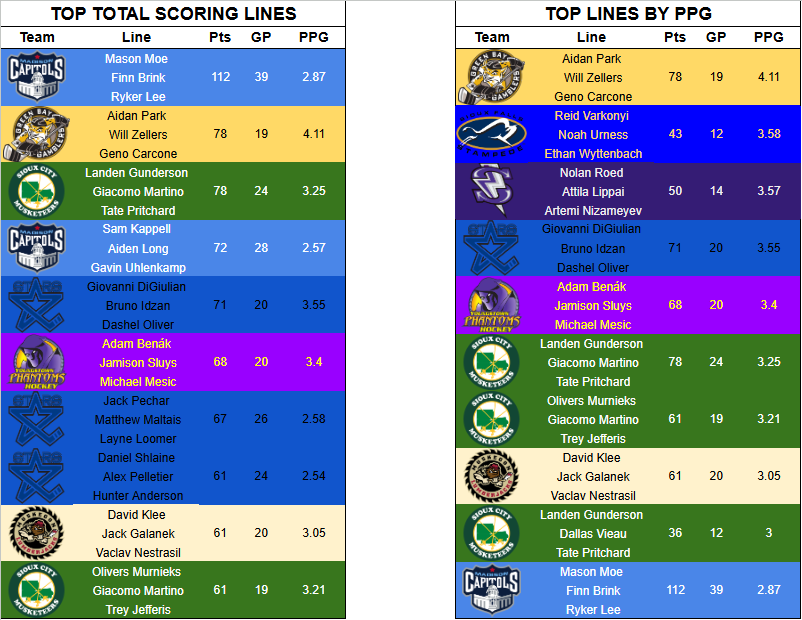
The forward results, for botoh seem pretty reasonable to me. Park and Zellers were two of the best Fs in the USHL this year, surrounded by other very high end USHL Fs as well. Wyttenbach ended up getting drafted out of that top Sioux Falls line, and Lincoln having 3 distinct lines near the top also made sense with how good they were, and how well Idzan fit on that team his first few weeks in North Americs.
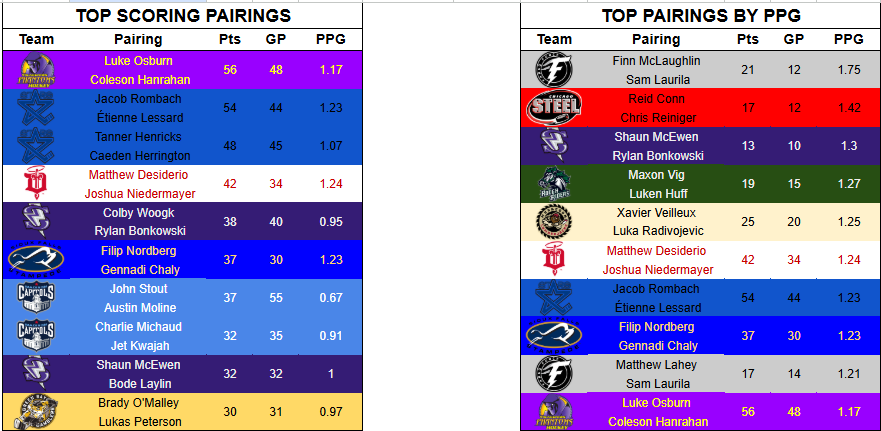
Now for the top D pairings, I feel like it was mostly which team's PP QB had the most common 5 on 5 partner. I'm not sure I would say Osburn-Hanrahan was the best pairing in the USHL this year, though certainly Osburn was one of if not the best defender, but they just happened to play with each other the most. Then for PPG, I'm really not quite sure how some of those pairings graded so well, Veilleux-Radivojevic, or McLaughlin-Laurila make sense, but I'm not sure how that Steel pairing, or the 2nd Fargo pairing were top 10, other than Laurila being a great player and potential guy to keep an eye out on moving forwards, especially as a very young player for an overager.
I was able to condense all of the remaining data, position balaneces, point estimated WOWY's, and the rough P/60 estimate, onto one player card, that looks like this:
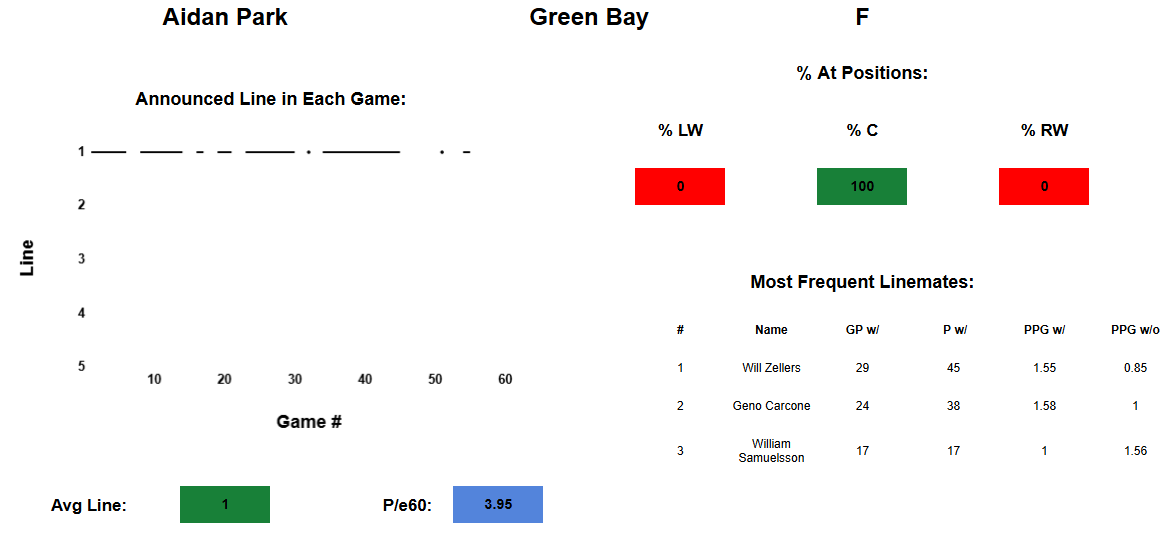
I was however, unable to make that into a shiny app or other web app at the current moment. And also, because there is some paywalled data (the game by game stats from eliteprospects) I don't want to just make the sheet public, unfortunately, but if anybody sees this and really wants to see what a player's card looks like, I will be more than happy to share with you.
Data
I collected all of the line data for this myself, based on what teams posted on social media, and not every team posted every game, so I was missing a few games. Then the points data was acquired by looking at the individual game by game data on eliteprospects, which is a premium feature, I believe.