Overview
The final goal, basically, of my whole xG project was to build an RAPM model. I had some other ideas, that I'll talk about later, but I wanted to try my hand at making an RAPM model. Obviously this is nothing new, there have been a few other people to make RAPM models in the past, Evolving Hockey being the primary ones, and I used their writeup as a guide for this. I also found some discussions of RAPM in basketball to help me make this, and discussions with Patrick Bacon and others to help sanity check my original model.
If you want a detailed explination, feel free to go to any of the sources I listed above, while I understand what I'm doing, I am also generally not good at explaining complex things, and feel like those resources that helped me would be of greater use than what I can write, but here is what I did. RAPM is basically just one huge ridge regression model that adjusts for any bit of context a player could have. A lot of models will seperate by game state and strength, ofensive zone or defensive zone draws, and, most importantly who is on the ice and off the ice. They do that be creating a massive dataframe with 1s for every situation where a set of n players is on the ice in x state with y scoreline and z zone start. Then they look at the time players spent in that state and have a list of stats they are trying to predict using each state. I simplified it to only look at the attacking (or defending if looking at defensive metrics) team, and the score of the game. I also filtered to only 5v5, just to keep things simpler. This vastly reduced the number of line in my dataframe when it came time to run the regression which was a priority of mine becaause never having ran anything like this before, at least with anything close to this size of dataset, I wasn't sure how my laptop was going to be able to handle it. So yes, my RAPM is only at 5v5, and only takes into account QoT, not QoC, but that is the far more important stat between the two in 99% of cases, so I think my model is still *useable* if not the best, most detailed model out there. Hockey isn't like basketball where you play the majority of your time vs a few players, there are constant changes and most coaches struggle to perfectly line match in a lot of games.
My dataframe, for each season consisted of just under 1000 columns, 800-900 for the names, one for toi, one for the score difference, and a bunch for the stats. Then it consisted of tens of thousands of rows at least, one for each individual group of players and game state. I did group by all of the players/game state, so that if a team started with the same 5 guys every game, they would have 1 very long "shift" of toi together equal to the total toi of all they played together instead of having a bunch of different shifts with the same 5 guys and game state. I don't know if that is standard practice or not, but it reduced the size of the df greatly, and I don't think lost me any more information, so I don't see why not. So I was left with an incredibly sparse df with a bunch of 1s and 0s, some TOIs, and some stats to predict. I initally just ran a regular multi-linear regression to calculate the APM, with predictor variables being all of the players, and the target being the stat I'm trying to predict (xGF, GF, CF, etc). Then the resulting coeffecients for each of those models, for each player, is that player's APM stat. That looks good for the most part, McDavid looksed good, Jack Johnson didn't, usually, but where it struggles is with low time on ice players. So we had to runn a ridge regression that can lower coeffecients towards zero when they have low TOI, with a penalty factor equal to one over the squart root of the "player exposure" (toi * number of appearances). That penalty will be much higher for guys who played less than 10 games, than guys who played the full 82. Then I ran the regression and again got the resulting coeffecients and made them that player's stat. This didn't totally work perfectly, because lower sample guys still tended to play a higher percentage of their time with one or two players, and the model always tends to struggle attributing success in those situations. But after a certain point (usually 20-25 games) the model usually stabilizes and can be somewhat safely used to evaluate players. I also ran the model for every year seperately, so I didn't get any three year samples or anything like that, only individual seasons.
Results
The first thing I wanted to do to check my results was look at the top players in a few stats from the previous season. I got some mixed results, some players I expected to be at the top, especially in the offensive metrics, then the defensive metrics were iffy, I got confused on multiplying by -1 to flip the z scores (less xGA is better, so that would be a lower z score usually) and then couldn't even tell if which side was supposed to be the best and worst players. So I'm not sure how much I trust my RAPM model for defense, but offense it looks solid:
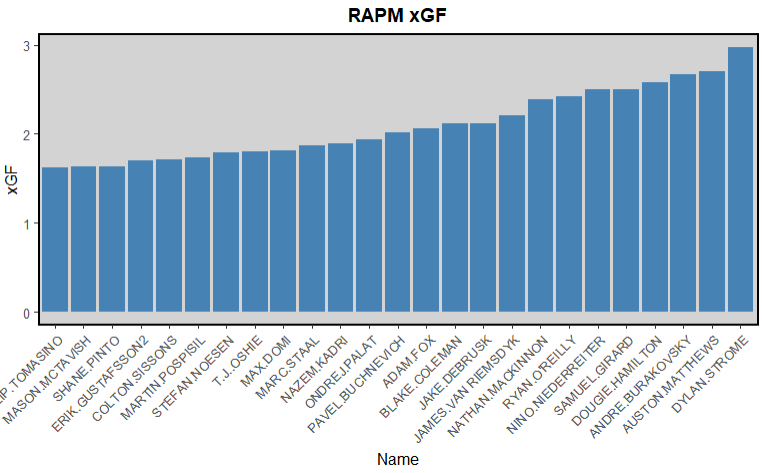
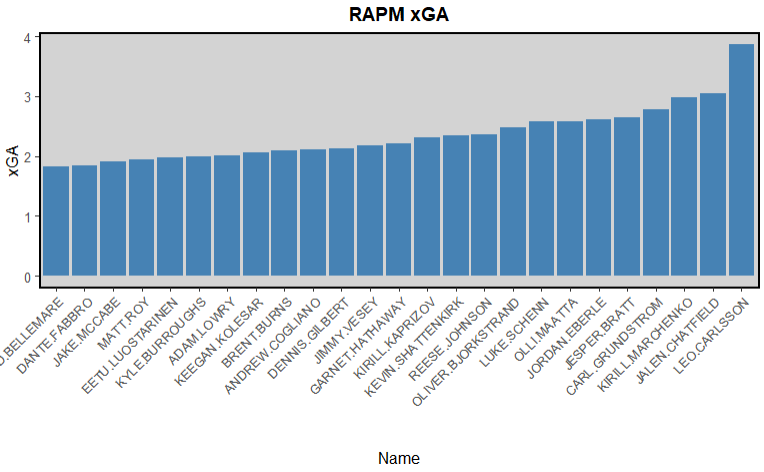
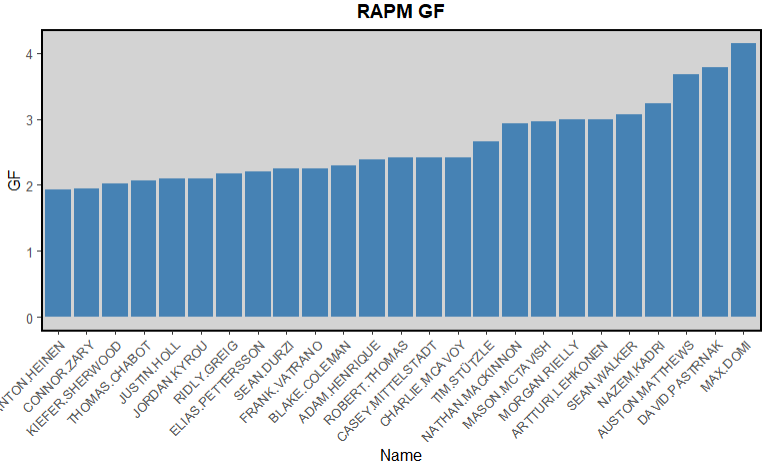
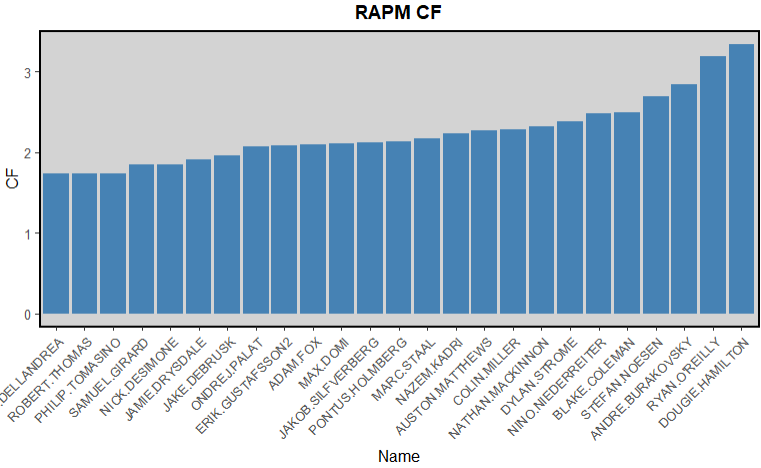
Looking at xGF, Strome being on top surprised me, but Matthews, Dougie, Mack all being up there gave me confidence. Then there were definately some names that I think got misattributed some of the cause, Staal, Tomasino, Pospisil, Oshie. Not that those guys are bad players, but would never expect them top 25. Similarly for xGA, I know Chatfeld is really good, but Leo??? I have no clue, but the opposite side had like TJ Oshie and some guys who I knew were horrible defensively, so I went with this side to be the top, but genuinely couldn't tell if I messed up or not. GF and CF look a lot better compared to what you would expect, Dougie at the top, you can take the man out of Carolina but you can't take the Carolina out of the man is how the saying goes I think? ROR, Mack, AM, even Drysdale is good offensively and justifieable to be up here, Morgan Rielly, Stutzle, EP, all these guys make sense. Then Kieffer Sherwood, Nick DeSimone, some low sample size guys who probably shouldn't be here and I certainly wouldn't value them this highly, but it doesn't shock me to see a few random guys like that up here who probably didn't play as much as the rest of the list.
The next thing I wanted to look at was how repeatable each of the RAPM stats are. I wanted to look at how they did regardless of their systems and structures because that is what I was trying to measure. So I filtered my data set to only players who played for different teams in consecutive seasons. Looking at that data, I was still expecting RAPM to be somewhat predictive buy it largely wasn't, regardless of the stat I looked at:
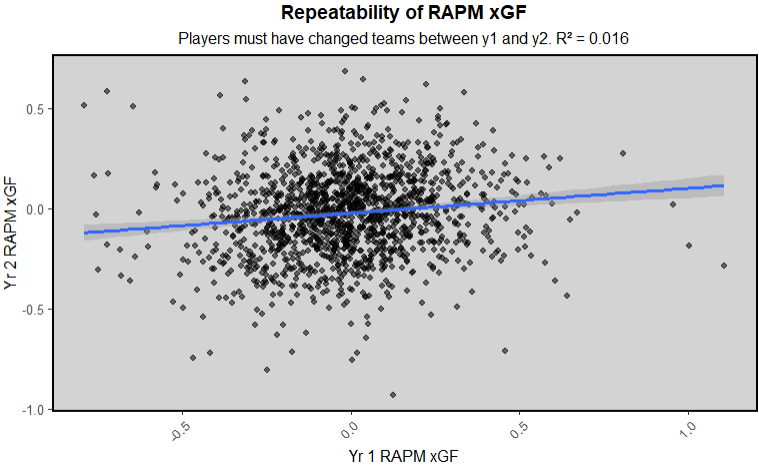
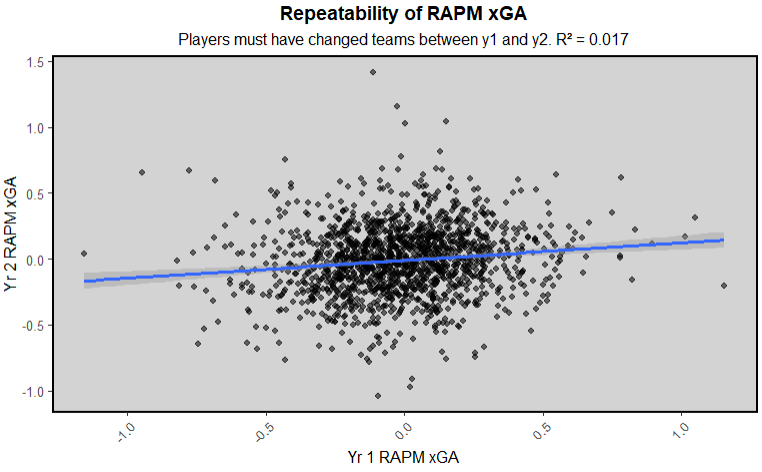
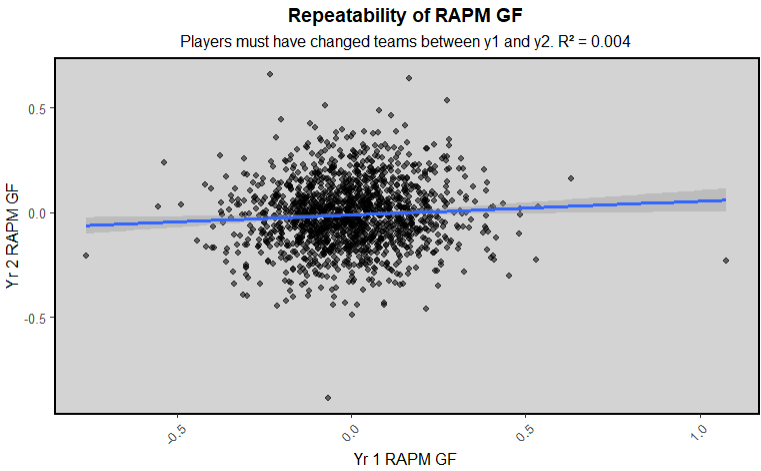
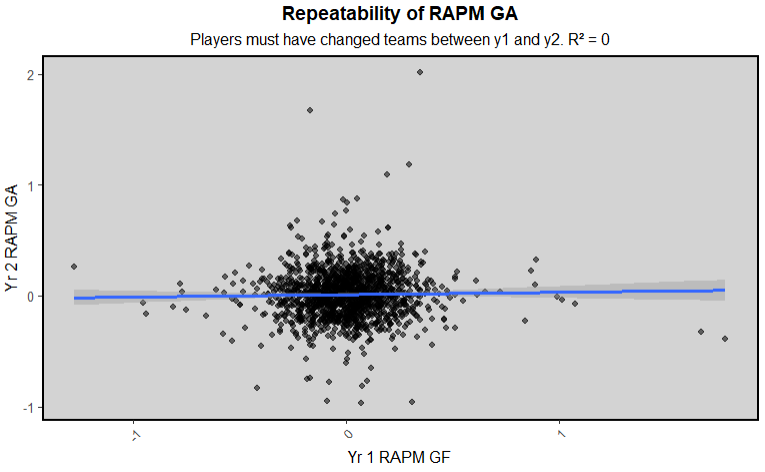
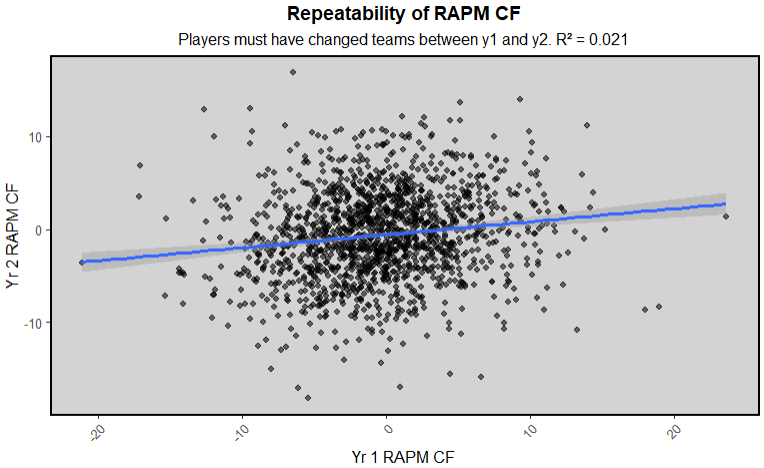
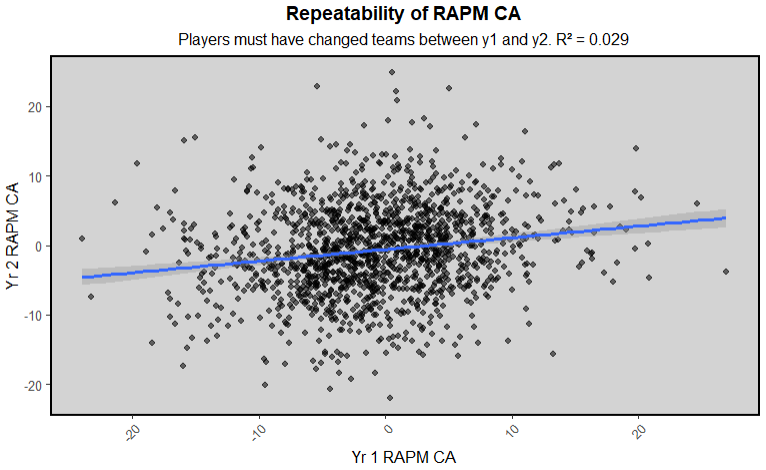
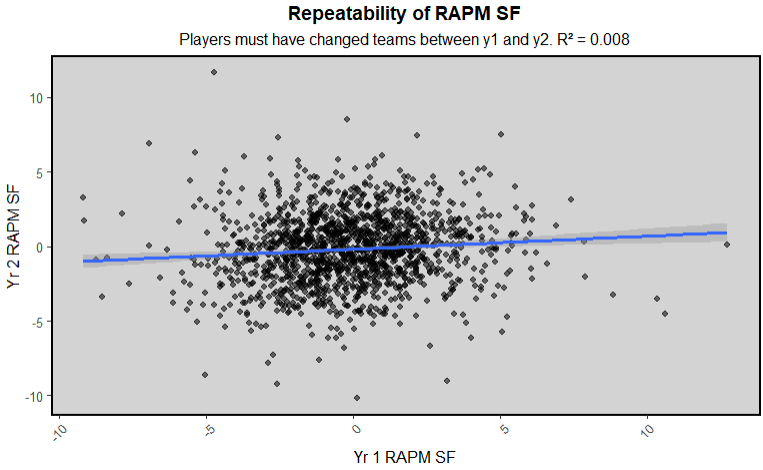
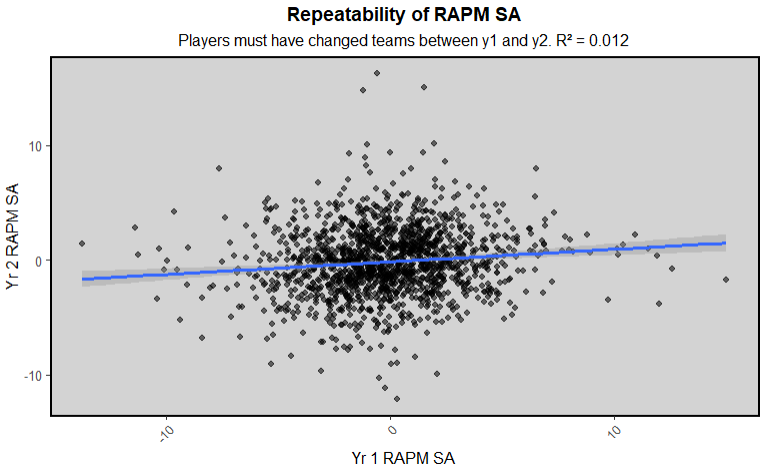
Basically all of these are just blobs centered around 0 with some players a bit higher reaching out high or low on one year, but very rarely sill high or low the next. It probably would have been better to look at the z scores for each player instead of the coeffecients, but I didn't, and I didn't think that would make so much of a difference. Obviously I wasn't expecting GA to be repeatable in any of the stats because I didn't account for goalies at all, and goalies have the most weight on goals against. So when a player changes teams, it is fully expected that their GA will change. I also didn't filter for TOI, so maybe if I only looked at "full time" NHLers these stats would be more repeatable. However, I just don't think one can really use one year RAPM sample to predict the next year's RAPM sample, or at least there are other factors at play (usage, opponents, goaltending, or development/regression) that I didn't measure/account for. Despite this, I still think that in a vacuum, you can use my RAPM to evaluate players in seasons that have passed, with an approiately sized grain of salt taken into account. I made a few apps that you can use from the main analytics screen to look at RAPM results player by player.
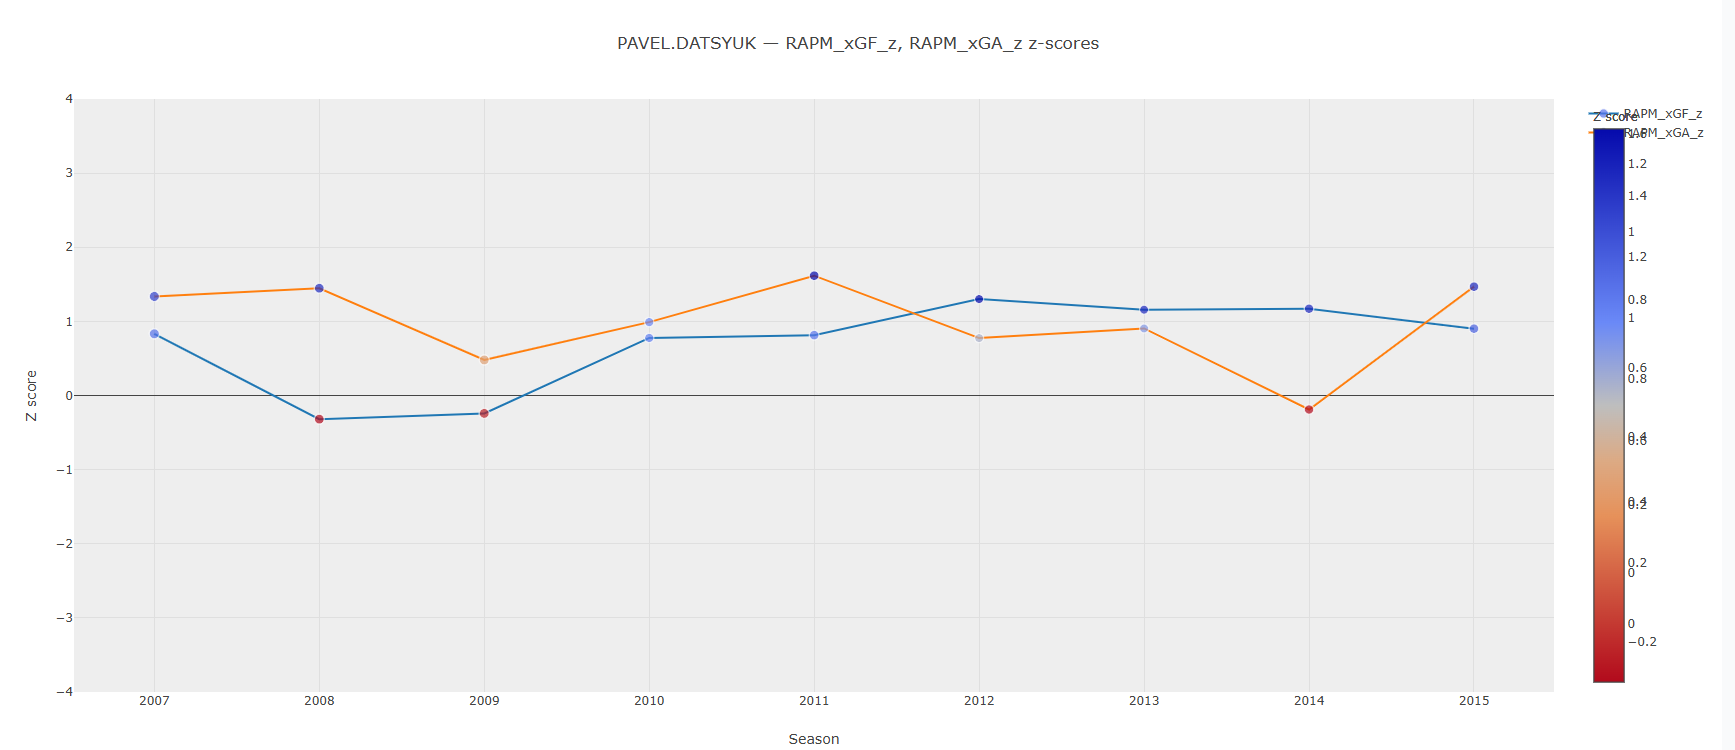
This is the career chart, you can look at any combination of RAPM (or other) stats. I didn't notice that the scale gets in the way of the key, but you can still kind of see it, and with one stat for a career it looks fine. Also just look at Datsyuk, one of my favorite players of all time, and potentially the best TWF of the analyical era. We missed out on a lot of his best years, but the consistency was incredibly remakable, and almost unheard of with my stats especially. Both offensively and defensively almost always well above average, to near the top of the league.
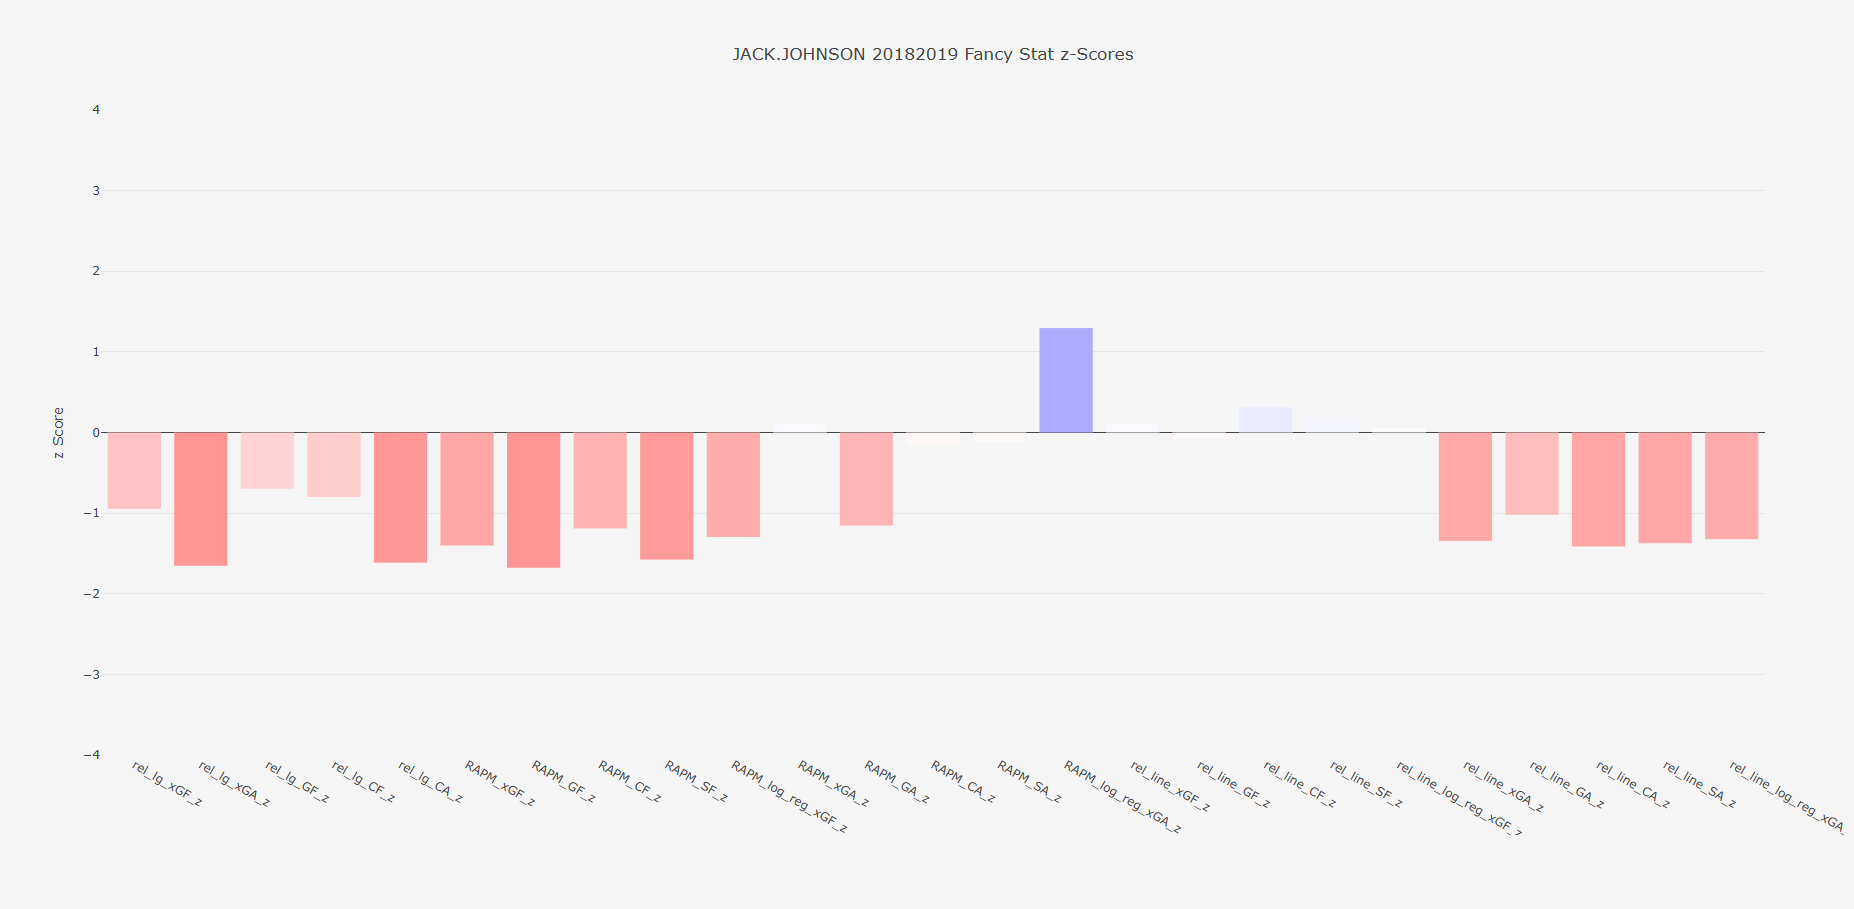
The single season charts are probably more fun to me. They show more than RAPM stats, they show how the player did by almost any stat I made, which shows that Jack Johnson wasn't good by almost anything. Yet Jim Rutheford still felt the need to give him *that* massive contract. Great guy, just not a good enough NHL player for that deal, and I still do find it funny. I'm sure someone could take some of these charts out of context, but from the player's I've looked at, I quite like most of them. Good players (in my mind of the public consensus) are usually good in more stats than they aren't, and bad players (in public consensus) usually seem to have more red in their charts. Obviously on the margins, comparing very similar players I would not take a definitive this player is better from these charts, but in general I was happy with how they turned out.
Data
I did get most of my shot data from evolving hockey's querey feature. I hae tried to run scrapers to get data directly from the NHL api, but it's always been a mess every time I've tried to build that scraper in particular. I've built many others succesfully, but just never one for the NHL API. So the EH queries are the next best thing, and they come mostly pre-cleaned. Though they were behind a paywall, I feel like I've done enough data manipulation that I can share this, especially in a portfolio style website that I don't plan on being profitable from.