Overview
Continuing on with my draft and prospect analysis now that I have an NHL adjusted points model that is approximately equivalent across all players in all leagues I could do a lot with that data. The first thing I wanted to do is look at which NHL teams are best at drafting and developing talent. Now, obviously, there is far more to the draft than simple scoring, but, as a whole over the course of entire prospect pools or draft classes, I would like to think that the math evens out. In general lower scoring players make it at a lower rate than higher scoring players, and theoretically, with larger and larger sample sizes, for every low scoring player that has the grit and intangebles to make it, there's a high scoring player that relied on his linemates or didn't have the drive to make it at the next level. This is part of the reason why I don't like using NHLe models to evaluate individual prospects with any sort of definitive sentiment. Sure the guy who scored 2 points in 30 Liiga games isn't likely to make it, but what if he got 4 mins of ice time a game with 4th liners and hit 5 posts on the year, there's always more contexxt when looking at an individual player. However, I feel somewhat comfortable doing analysis on larger sample sizes, because outliers like those low scoring players that make it, or high scoring guys that do tend to cancel each other out. Also, while sure, the eye test is certainly important, especially for prospects, anybody who fully dismisses the idea of stats being used is behind the times, and willingly putting themselves at a disadvantage. Every eye test has different biases, takes years and years of practice to train to actually be accurate, especially when evaluating players across many different levels, and there are simply limiations to the amount of players you can evaluate in a given time that don't exist with stats. And while we don't have all of the fancy stats for prospects that we do for the NHL, we still have basic stats like points, which are still the best thing that we have, and better than nothing. Just because we have something better for evaluating NHL players doesn't mean that points are totally worthless when you don't have anything better.
Now moving on from why I believe NHLe is an acceptable stat for a project like this, I want to talk about some of the other decisions I had to make in the process of doing this analysis. First, what is development? I choose year to year increase in league adjusted scoring because that was the easiest thing to measure with the stats I had available to me. There are issues with this approach because to measure the how well at developing players one particular team or league does, the player needs to play for that team/be in that league/be in that teams system for both full seasons, or else we don't know how well each team/league developed the player relative to the other(s) the player spent time with. There is also the issue of non-linearity in development. Players don't get better by the exact same increment game by game, especially when our measure is points, players don't always score more points than they did in the previous game, though if a player could do that, it would be nice. That shows why measuring development on a game by game basis is stupid, you need a big enough sample for the points to even out, but how big of a sample should be used? Month to month development, half to half development, year to year like I chose, or simply what the player eventually developed into, and you only get 1 data point per player. I think all of those options would be valid, and I've done a bit of work with just looking at what each player became as the end "target" for development. Ultimately, I did just select year to year development, because I think it gives the best blend of still having a large sample size, but not being too volatile like month to month would be. Also it was simply easier to get the data rather than looking at the dates every player scored their points on to work with month to month, or half year splits.
Once I made all of those decisions the rest of the analysis was relatively simple. I created 2 models for development, and one for analyzing the draft. For the first development model, I simply looked at the DY to DY+N average increase in scoring for each N between 1 and 5. For the second, I figured first overall picks who are expected to be stars are likely to devlop more than 7th round picks who have little expectations, so I created a regression model to predict the devlopment of a player using their given draft slot. I then subtracted that number from the actual devlopment number for every player to create what I called a DevoX model (Development over Expected). Then for the teams, I just took the average DevoX for each player and looked at that. For the draft analysis I did the same thing as with my DevoX model, created a regression model to predict scoring rates at each draft selection then subtracted each players actual scoring rate from their expected scoring rate given their draft slot. Obviously this is somewhat flawed because teams will have entirely different drafting strategies. One could argue that scoring is not important to some teams, and they would grade their drafts as great successes after drafting nothing but 6'6 players who didn't score, but would look like they had terrible classes using my model. However, I am trying to analyze how successful teams were at drafting using a standard target (high scoring) and using only what we know at the time of the draft (the players scoring rates in their DY). Is that a perfect measure of good drafting, no, but as I said earlier, I believe that on average, higher scoring draft classes do better than lower scoring draft classes, and that is what I'm evaluating here.
Results
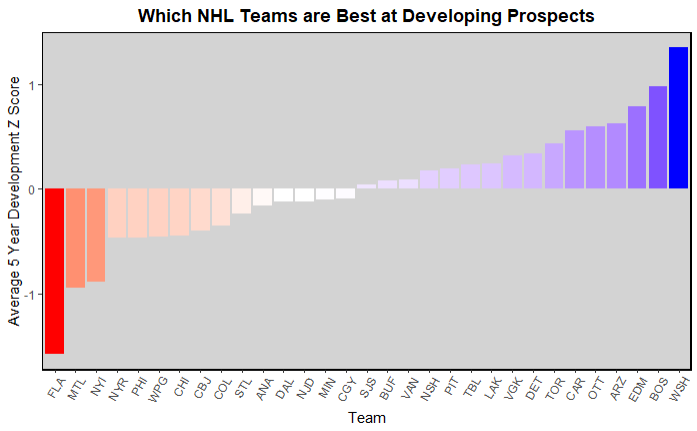
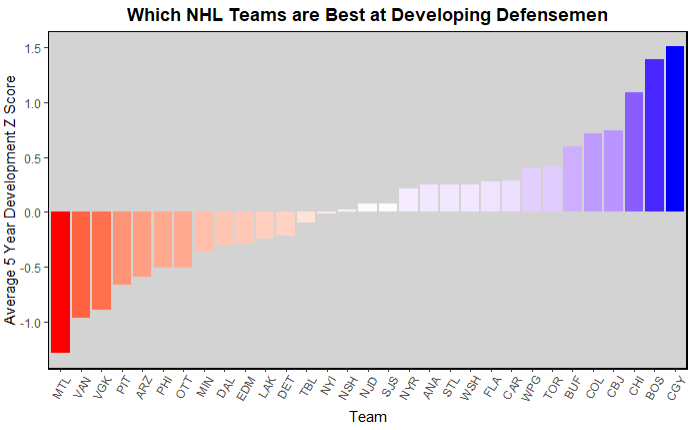
I mainly looked at DY+1, DY+3, and DY+5 for development, because those are different enough to each other taht they are measuring "different things" or at least different aspects of the same thing. DY+1 is kind of measuring partially how well you pick players who are easiily teachable and/or had down years in their DY and can bounce back. DY+5 is measuring how well you develop players through their careers, because by the time someone is in their DY+5, they are usually pretty close to finishing their development. Then DY+3 is kind of a mix of the both, how well can you develop players somewhat quickly after getting drafted. I also made seperate models for drafting and forwards and defensemen, because those are totally different skills, and I feel a lot more confident in my modelling process for forwards than defensemen. So the results for DY+1 Fs and Ds are below:
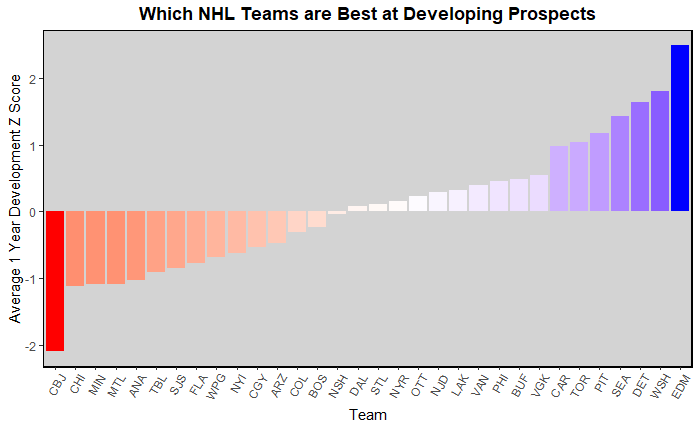
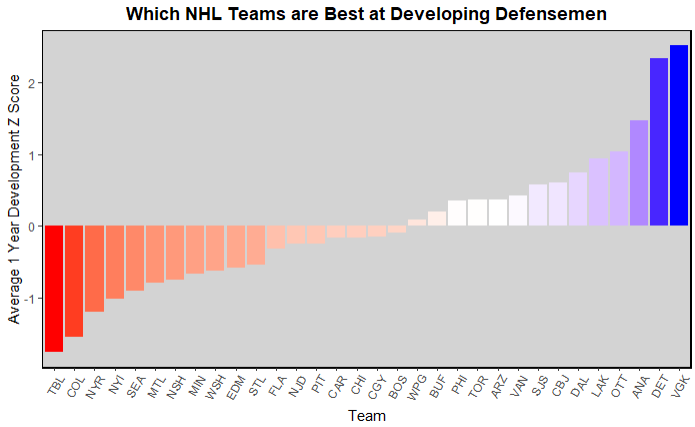
I feel like this is one of the harder models to check if the results make sense, so I am kind of just going to say here are the results, and here are my theories to explain why those results happened. Edmonton being way out in front for Fs, I'm going to guess is largely because McDavid and Drai, and their other 1 OA picks having good enough DY+1s by simply making teh jump to the NHL that they didn't tank their rating at all. Then Pittsburgh, Washington, Seattle and Detroit being so high because most of them had the fewest number of picks during this time because they've either been competetive for over half the time (since 00) or have only existed a few years, so a few good developmental players, Crosby/Guentzel, Datsyuk/Zetterberg, or Ovi/Backstrom could have carried those teams to high ratings. Now for low teams, I think CBJ and MIN make a lot of sense, CBJ has consistently struggled to not only keep the talent they get, but also develop new talent, for most of their time existing as a franchise, and Ifeel like MIN is similar, their talent seems to come a lot from FA or trades, aside from Kaprisov, and in recent times with Judd Brackett as head scout they've been drafting increibly well by point standards, but still seem to not be bringing through much talent quickly. ANA and MTL being near the bottom doesn't shock me, looking at the results from most of MTL's classes from the early-mid 10s, they developed hardly any NHLers, and ANA for a while there seemed to have a somewhat bright future with guys like Comtois, Steel, Jones, and Terry, but none of them developed. Conversly for d men, ANA has seemed to devlop a ton, Lindholm, Fowler, Mahura likely graded well scoring wise, Lacombe and Thrun more recently. VGK and DET again likely small sample sizes with a few hits, and the bottom being Tampa is kind of surprising, but outside of Hedman I feel like they've acquired most of their top d men through trades. And I was tracking development from the draft, so a guy like Sergachev doesn't count towards them. Similarly, seeing COL seems to get a lot of d men from trades/FA outside of Makar, and seeing NYI and MTL near the bottom doesn't shock me as they seem to consistently struggle to develop talent as well.
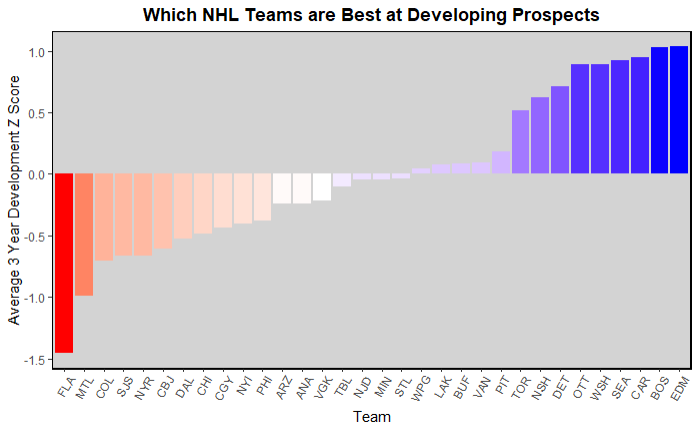
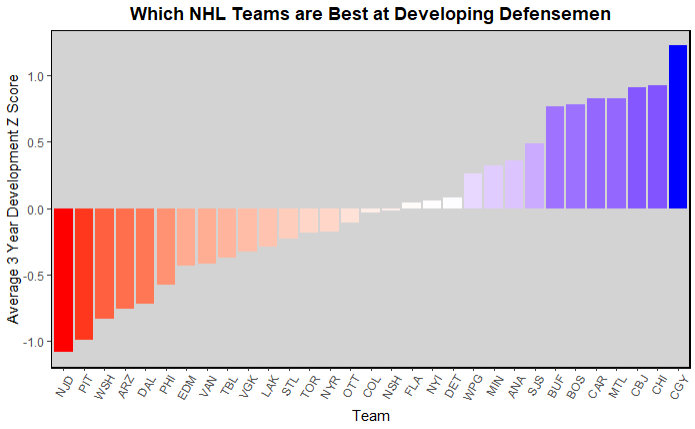
I think DY+3 Fs having a cluster of teams at the top makes sense, because it is kind of a blend of DY+1 and DY+5. Edmonton and Washington are still getting carried by a few results, but BOS is better in the long run, which makes sense with how they slowly brought along guys like Marchand, or even Bergeron I don't think made the NHL/was an impact player immediately. While a team like CAR is just kind of a jack of all trades, they're near the top, but not at the top for all 3 timeframes. Then Seattle still has a tiny sample size of well developed forwards. Because the absolute difference in DevoX from the top teams to bottom teams in the league is so small, one or two players could skew a team like Seattle's development a ton. Also, while it may not seem like they have devloped talent particularly well, you have to remember that development to the NHL is very hard, developing 1 out of every 5 guys to an NHLer is usually a great success rate (assuming you don't have 5 first round picks and zero other picks). Then seeing FLA all the way at the bottom was kind of shocking, but then I remembered that they were really bad for quite a while, then just recently got good by picking up a lot of busts or forgotten players from other teams. Not many of their talents were actually home grown guys who weren't expected to be stars (Ekblad, Barkov, Lundell all high first round picks). Then for d men, seeing PIT at the bottom also surprised me, but really the only good d men the pens have drafted and developed this quarter century has been Letang. CGY, CBJ, and MTL all surprised me being near the top, but CHI makes sense, I think most of their d core from the mid 10s was home grown. I also am not sure that using scoring to measure d man development is that effective, because the sample sizes are small, and scoring at the NHL is not particularly important for d men.
For Fs, seeing BOS, EDM, and WSH at the top again are not shocking, 2 out of 3 have been well run organizations that have produced some of the best Fs in the NHL in the past quarter century, and the 3rd, again, has Mcdrai. ARZ being 4th was shocking, and kind of inexplicable to me, there's a reason tat franchise is now in Utah, they really couldn't develop anyone to a solid NHLer, but they must have had just enough guys. This is where the sample sizes started to get quite small, there were very few players who were drafted, and played at least 10 games in all 5 seasons with their rights still belonging to the same organization. Then you look at the bottom 3, and I have already explained how it makes sense that all 3 are near the bottom, FLA with very few homegrown players, and MTL and NYI just with incredibly grim drafting and developing track records throughout most of my hockey watching life. Then for d men, again, MTL, VAN, and VGK all make sense near the bottom. VAN hasn't been mentioned yet, but seems to go through massive ups and downs with success and usually more downs, and thus have struggled to bring players through to success, then VGK just has very few players drafted more than 5 years ago, and even fewer that they haven't traded. Then 2 of the top 3 being CHI and BOS, again make sense, two well run (in terms of on ice product only) organizations who have developed a lot of their own defensemen.
Now looking at the above results for drafting there has been a lot more research into this area. Look at all of the many other NHLe models people have been making and posting over the past few years. My model tends to line up with the results from most of the others that I've seen. CAR over the past few years has consistently been heavy heavy model and public scoting favorites. TOR during the surprisingly lengthy Dubas era heavily favored scoring/analytics while drafting. WPG has seemingly been a consistent mini-CAR, always near the top of public scouts/models rankings, but never at the top. Then SEA has also drafted well in the public consensus since they've existed. I also have a theory that until recently, (the past 10-15 years) most teams undervalued the draft, and I would guess that the absolute difference in draft rankings would be pretty small, so CAR's heavy "great" drafting over the past few years can greatly swing their overall z score. Then BOS and ARI being at the bottom are incredibly unsurprising, BOS rarely drafted and seems to rarely draft high scoring guys, and ARI... well there's a reason they're in Utah, incredible mismanagement from top to bottom, which included many floundering draft classes. Then for defensemen, NYI at the top is surprising, I can't think of any great/highly thought of d men they've picked, but then TOR and VGK being the next two doesn't shock me, two teams that have been analytically inclined, and generally tend to draft prospects who are highly thought of, regardless of whether they end up successful with that team or not. Then BOS and OTT being at the bottom also is unsurprising to me, BOS for the same reasons as their Fs, and OTT recently taking a lot of lower scoring d men high, Sanderson, Kleven, JBD iirc. Obviously they've had mixed success with those picks, but it was inarguable that Sanderson was not universally viewed as a great pick at the time. However, I would also be cautious at using points to evaluate teams ability to draft d men. Obviously they are important, even for DFDs, they still need a requisite amount of puckhandling and vision to be able to get pucks out of the defensive zone in the NHL. And those skills almost always are enough to lead to a decent amount of scoring in juniors. And conversly, no matter how great a player is defensively, if they don't have enough skill to get a few points in juniors, they will almost certainly fail to have the requisite skills to get pucks out of the defensive zone in the NHL. However, beyond that minimum skill level required, I am not sure how well points alone do at predicting NHL success, and that is where you have to start looking into defensive ability and playstyle. If an OFD barely meets the requisite skill/scoring level, they are very unlikely to succeed, but an incredible DFD who barely meets the requisite skill/scoring level is somewhat likely to succeed
While I feel like most of the results I got were explainable, I don't know how applicable they are. Development is one of the most important parts of having a good hockey team in my opinion, right up there with good player evaluation and good FA/trade negotiations. Without good development, your draft picks become worthless, and you have to resort to trades and free agency to build out depth and get star players, and you don't get to save money on homegrown young talent. However, it is one of the hardest things to accurately measure. It takes so much time to develop any one prospect, that it will end up taking many years to develop enough prospects to have a solid sample size that isn't skewed by one random bust or incredible steal. But during that time, management and development coaches are likely to change at least once if not numerous times, so I'm not sure how much just looking at team development since 00 actually tells us. It would be better to look at how individual devlopment coaches, or potentially GMs (assuming they keep a consistent drafting and developing philosophy) do in stats like this. However, I don't have the data on where every GM was during this timeframe, and would have no clue on where to find development coaches team history. Also I would likely run into sample size issues with players having the same GM/development coach for 5 years, especially with development coaches.
However, I do think my work on this project was a good starting point for this research. I have never seen someone try to numerically evaluate NHL development before, so if anybody wants to build off of my work I strongly encourage that, and would love to see what the rest of the analytics community could do. And if anybody would like my data or (somewhat spaghetti) code to do more work on this, feel free to reach out to me and I'll be happy to provide it and discuss any ideas you have.
Data
This is the start of many projects where I got basically all of the data from eliteprospects. I basically only used points and leagues from EP to evaluate players each season.