Overview
Obviously I have a large focus on hockey because that is my favorite sport (that has easily accesible data) but I do have interest in other sports and aspects of life. Particularly as big events in other sports, football season, or in this case, the NCAA basketball tournament I tend to rush through building models to predict the outcome of whatever event is happening at the time.
For the NCAA tournament I wanted to challenge myself to make a model to predict the tournament in a day or two before the tournament. I went into this knowing very little about college basketball, I knew Auburn was good but struggled late, Duke with Cooper Flagg was a wagon, and Houston was solid and consistent, but outside of those few teams I knew almost nothing. I had also done nothing of the sort before, so I had to do some research on what stats for CBB that were easily accesible are viewed as effective and useful. I settled on using barttorvik's Adjusted Offensive and Defensive Effeciency, TOR and Offensive Rebound stats, as well as 2P and 3P offense and defense, Adj T score, Evan Miya's player rankings to look at star players, and historical win percentages from certain seeds as a base. I also looked at but didn't use record against quality opposition. For the Star players stat, I simply looked at which team had the higher rated top player (or average of top 3 players, I forget and can't find where I did the calculations initially) because I know basketball tends more towards a strong-link sport and I wanted to take that into consideration.
The model was relatively simple, just starting with a base of x% for each game, where x was the percent of times that seed advanced past that particular round (not percent of times that seed won that particular matchup, because beyond rd1/2 some matchups become incredibly rare) I then looked at how each team at that seed stacked up to other teams at that seed in the past in my chosen stats, and used that to adjust their odds at moving on in each round. Basically all I did was create a logistic regression model to predict the likelihood of a team advancing past a certain round using each stat, then I took the weighted average of each of those models, and the base seeding win percentage and got a new "win percentage" for each team. Because I didn't look at their oponent, and seeding isn't fair (sometimes a stronger than average 1 seed, Houston, would be projected to play a stronger than average 8 seed, Gonzaga, in rd 2) some games had win probabilities over 1 for both teams combined. I fixed that by simply looking at each matchup, or "region" and dividing each of their individual win percentages by the sum of all of the win percentages from that matchup/region so that they all summed to 1. Regions being any group of 4 teams where 1 of them will reach the sweet 16, or group of 8 teams where 1 will reach the elite 8 and so on.
Results
The odds of each team advancing to the given round are in the following chart: (yes, I built the model before the first four games, and did not want to predict those abominations. Return to 64 teams)
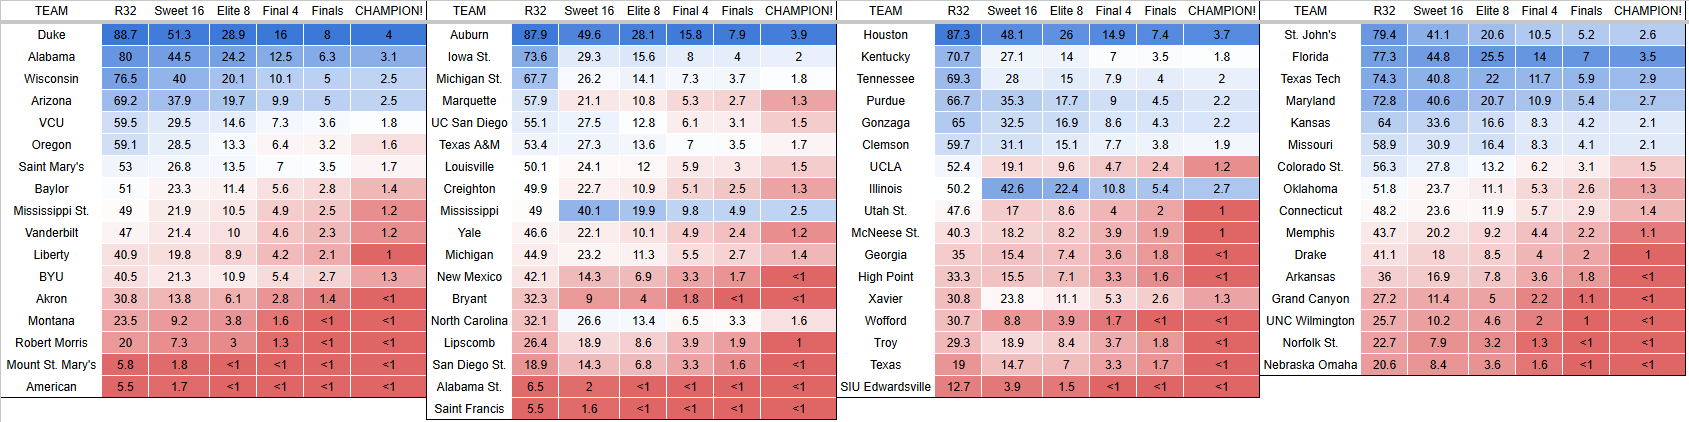
The overall results were mixed, it predicted 75% of the first round games correctly, got 75% of the sweet 16 and elite 8 teams correct, and correctly predicted that all 4 one seeds would make the final 4. However it missed both of the final four games, which those are the ones that really matter in terms of the ESPN bracket challenge, so the model was only in the 62.7th percentile. It also had an RMSE of 0.0769083462 overall, and round by round RMSE in this graph:
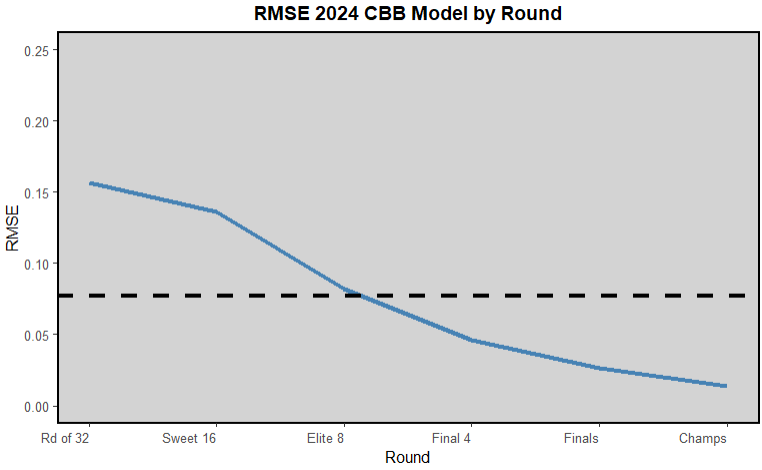
Which shows a decreasing trend in the RMSE as the tournament goes along, which is not surprising because it is unlikely that any individual team wins the championship, so the model predicts that every team has low championship odds, so when every team gets eliminated but one, the squared error for each of them is very very low. Obviously if I had re-ran the model at the start of every round predicting new games, the RMSE would have gone up, but that's not how predicting the CBB bracket works, you have to go for perfection from the start.
I was more impressed with this model looking back on it months later writing this than I remember being at the time, 62.7th percentile while getting none of the final four games right, and overall somewhat low RMSE's. But then I looked at what a simple "model" of just picking the higher seed with 100% confidence looked like, and it performed at worst equivalent, getting 1 more game in the first round right, and having a lower RMSE in the remaining rounds. Then I remembered how chalky this years tournament was, and am intreguied as to whether that helped or hindered the model. I'll have to have another go around next season to see if I can top this year's performance. Also will be interesting to look at going forward, how chalky all the tournaments are in the future, because it is still a best of 1 game, but more of the better and more experienced players will likely conglomerate onto the teams willing to spend the most NIL money.
Data
As mentioned above, I looked at Bart Torvik, and Evan Miya's sites for my data but I looked at numerous other sites the KenPom rankings, ESPN's power index, and simple things like wins and losses and whatnot from college basketball reference and previous tournament data from wikipedia